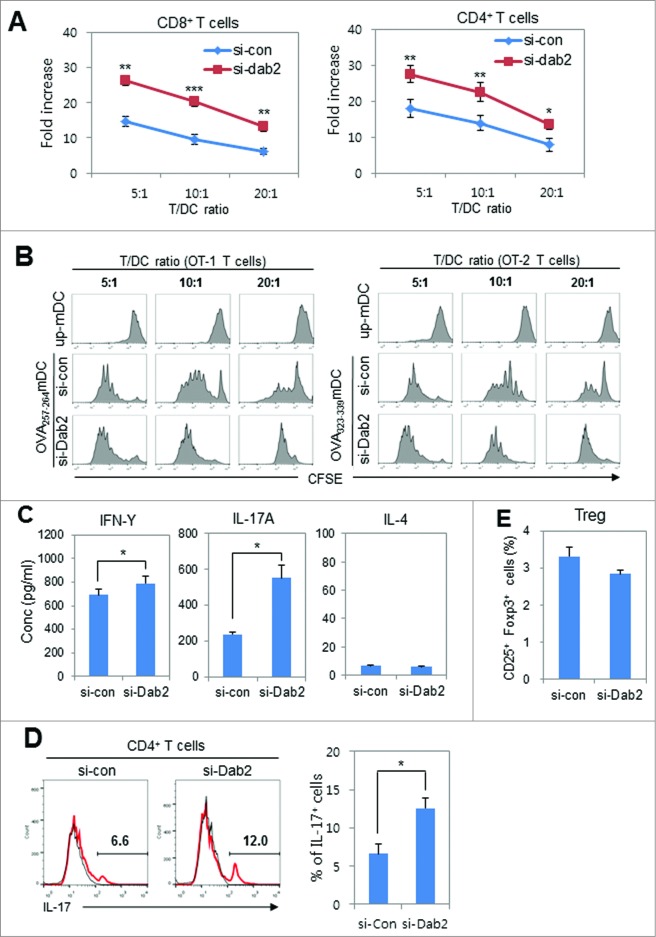
Figure 5 (See previous page).
The effects of Dab2-silencing on the ability of BMDCs to stimulate T cell proliferation. (A) WT and Dab2KD mDCs (from C57BL/6 mice) that were pulsed with OVA257–264 or OVA323–329 peptides were co-cultured with CFSE-labeled OT-1 or OT-2 T cells, respectively, for 4 d at three different ratios. CFSE-positive proliferated (CFSE-diluted) T cells were gated, calculated, and represented by fold increases as described in materials and methods. Data are shown as mean ± SD of six samples pooled from three independent experiments. *p < 0.05 and **p < 0.01, Student t-test. (B) OVA peptide (OVA257–264 or OVA323–329)-pulsed WT and Dab2KD mDCs were co-cultured with CFSE-labeled OT-1 or OT-2 T cells, respectively, for 4 d at different T:DC cell ratios. CFSE-labeled proliferating T cells were gated and represented by histogram. (C) Th1 (IFNγ), Th17 (IL-17), and Th2 (IL-4) cytokines in the supernatant of DC/T cell co-cultures at a 1:10 ratio were assessed by ELISA at day 3. The data are shown as mean ± SD of six samples pooled from three independent experiments. *p < 0.05 compared with WT (si-con) DC, student t-test. (D) Treg cell populations were assessed by intracellular Foxp3 staining and CD25 surface staining from co-cultures of mDCs (C57BL/6) pulsed with OVA323–339 peptide and OT-2 T cells at a ratio 1:10 for 5 d. CD25+ Foxp3+ Treg cells were assessed by flow cytometry and are shown as mean ± SD of six samples pooled from three independent experiments. (E) OVA323–329 peptide-pulsed WT and Dab2KD mDCs were co-cultured with OT-2 T cells for 3 d, and Th17 cells among the OT-2 cells were assessed by FACS after intracellular staining with anti-IL-17 antibody (left). Statistical data (right) are shown as mean ± SD of six samples pooled from three independent experiments. *p < 0.05, Student t-test.

