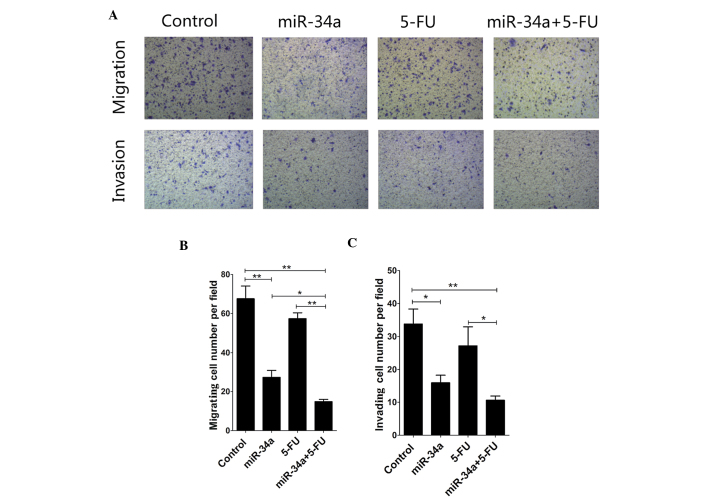
Figure 4.
Migration and invasion of SW480 cells following different treatments. (A) Brightfield microscope images (magnification, ×20) of SW480 cells from the different treatment groups, and quantified data from the (B) migration and (C) invasion assays. Data are presented as mean ± SD (n=3), with *p<0.05, **p<0.01.

