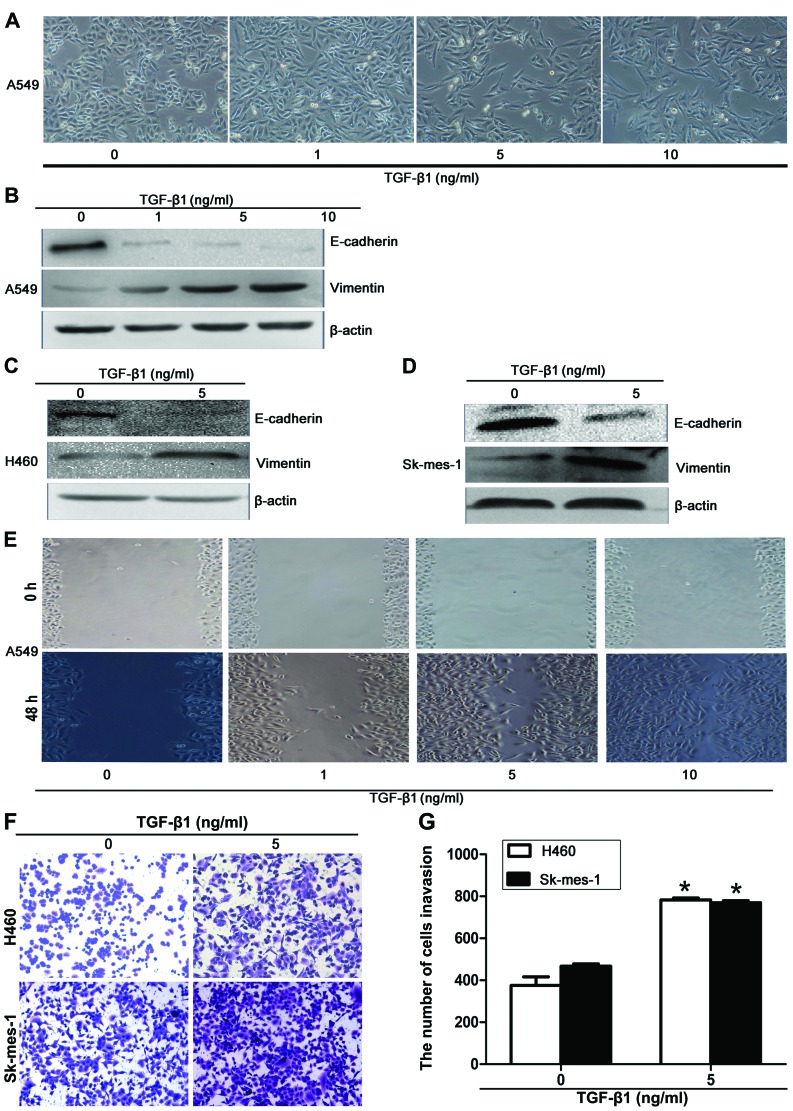
Figure 1.
TGF-β1-induced EMT in the A549 cell line. (A) Phenotypic alterations induced by treatment with 0, 1, 5 or 10 ng/ml TGF-β1 for 48 h (magnification, ×100). Western blot analysis to determine the protein levels of E-cadherin, vimentin and β-actin in (B) A549, (C) H460 and (D) SK-MES-1 cells treated with TGF-β1 for 48 h. (E) The migratory capacity of A549 cells was assessed by a wound healing assay. Phase contrast microscope images captured at 0 and 48 h subsequent to TGF-β1 treatment; magnification, ×200. Transwell cell invasion assay to analyze the invasive capacity of H460 and SK-MES-1 cells treated with 5 ng/ml TGF-β1 for 48 h. Invasive cells were (F) imaged with crystal violet and (G) quantified. *P<0.05 vs. control. TGF-β1, transforming growth factor-β1; EMT, epithelial-mesenchymal transition.

