Figure 3.
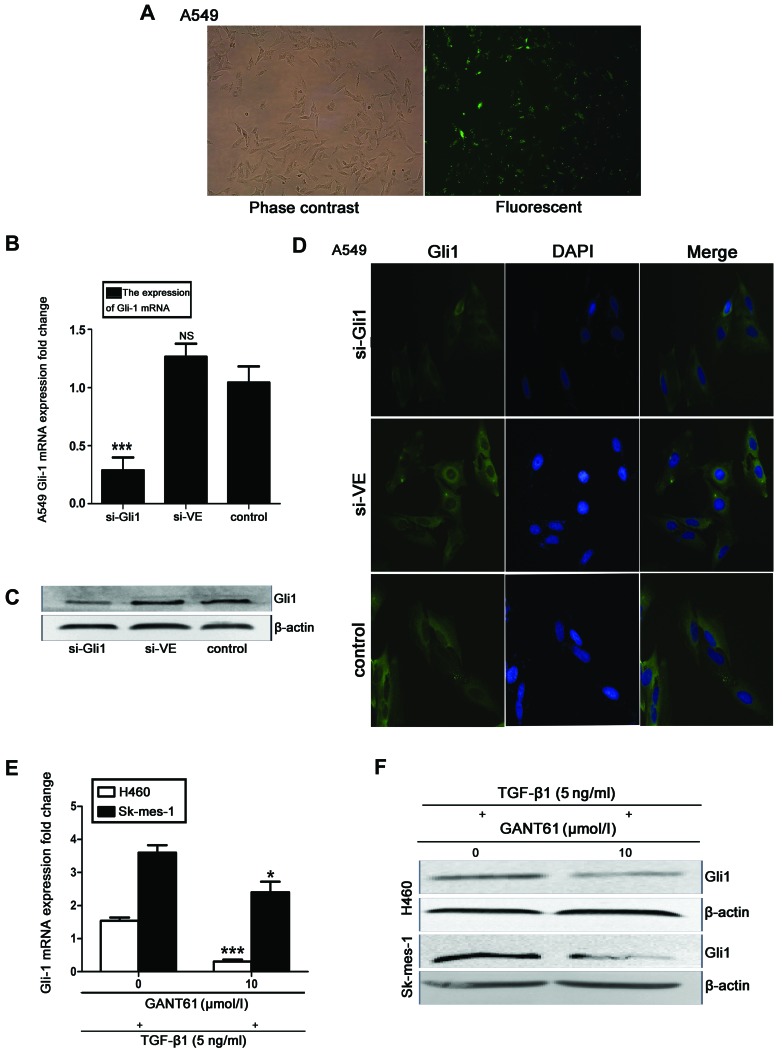
Effect of Gli1-siRNA and GANT 61 on Gli1 expression in TGF-β1-induced NSCLC cells. (A) Confocal laser scanning microscope images to assess transfection efficiency. (B) Gli1 mRNA expression levels were assessed by RT-qPCR. (C) Western blot analysis of Gli1 protein expression in the si-Gli1, si-VE and control groups, with β-actin as the loading control. (D) Immunofluorescence staining (magnification, ×400). All experiments were performed 3 times. (E) RT-qPCR assessment and (F) western blot analysis of H460 and SK-MES-1 cells treated with the Gli1 inhibitor GANT 61 (10 μM) for 48 h, followed by 48 h stimulation with TGF-β1. All values are presented as the mean, error bars represent the standard deviation; NS, not significant, *P<0.05, **P<0.005 and ***P<0.001 vs. control. Gli1, glioma-associated oncogene homolog 1; si-Gli1, Gli1 siRNA group; si-VE, nonspecific siRNA group; TGF-β1, transforming growth factor-β1; NSCLC, non-small cell lung cancer; RT-qPCR, reverse transcription-quantitative polymerase chain reaction.

