
Figure 6.
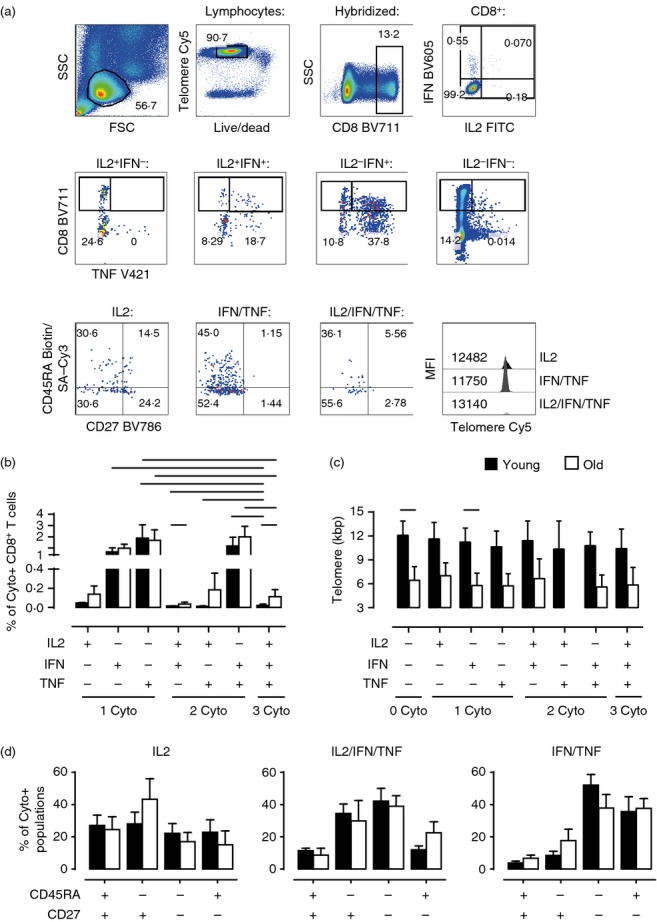
Simultaneous analysis of multiple cytokines, phenotype and telomere length within activated cytomegalovirus (CMV) pp65/HLA-A2 (NLV)-specific CD8+ T cells. Total peripheral blood mononuclear cells (PBMC) were stimulated with NLV peptide overnight then assessed by eight-colour intracellular cytokine flow-FISH to determine telomere length and phenotype (CD45RA/CD27) of the different cytokine-producing population [combinations of interleukin-2 (IL-2), interferon-γ (IFN-γ) and tumour necrosis factor-α (TNF-α)]. Representative example of gating strategy (a). For full explanation of gating see Fig.5. Numbers in pseudocolour plots represent subset percentages; numbers in histogram represent telomere Cy5 MFI. Bar charts showing the size of each cytokine population as a proportion of total CD8+ T cells (b) and telomere length of each population (c) stratified by age (b, n = 5–7 per group; c, n = 3–7 per group). For simplicity in (b), only significant differences between the two age groups and from the IL-2/IFN/TNF population are shown (for full statistical analysis see Supporting information, Tables S4 and S5). Bar charts showing the CD45RA/CD27 subset distributions for the IL-2, IL-2/IFN/TNF and IFN/TNF populations (d, n = 3–7). Data were acquired on a BD LSR II. Telomere Cy5 MFIs were first converted to MESF values and subsequently kbp using the MESF standard curve. Black bars represent young, white bars represent old. Statistical analysis was performed using the Wilcoxon Signed Rank test. All P values were < 0·05.