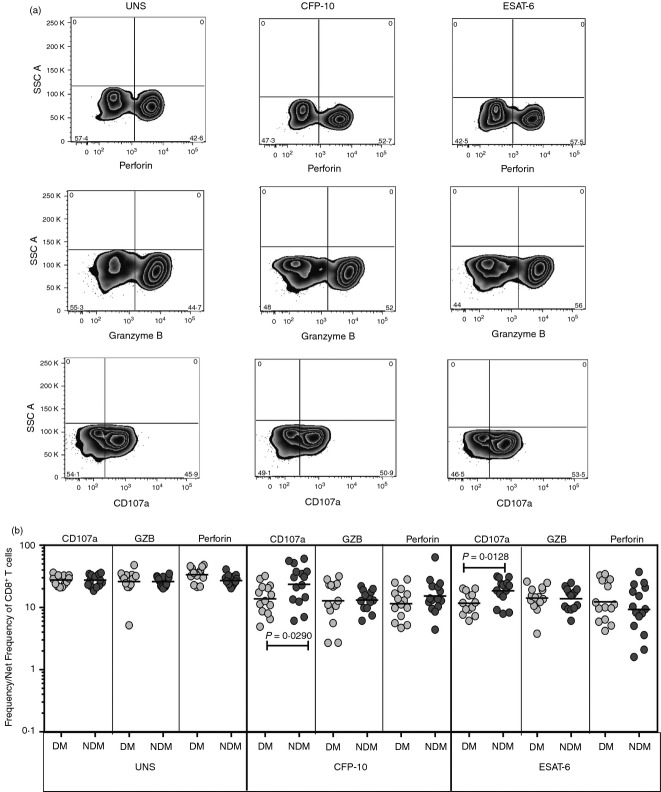
Figure 4.
Diminished frequencies of cytotoxic marker expressing natural killer (NK) cells in tuberculosis–diabetes mellitus (TB-DM). (a) A representative whole-blood intracellular cytotoxic marker flow data from a TB-DM individual showing NK cell expression of perforin, granzyme B and CD107a. (b) The baseline or antigen-stimulated net frequencies of NK cells expressing the cytotoxic markers perforin, granzyme B and CD107a are shown as scatter plots with the line representing the geometric mean of the frequency of NK cells expressing the respective marker in TB-DM (n = 22) and tuberculosis–no diabetes mellitus (TB-NDM) (n = 22) individuals. Net frequencies were calculated by subtracting baseline frequencies from antigen-stimulated frequencies. P-values were calculated using the Mann–Whitney test.

