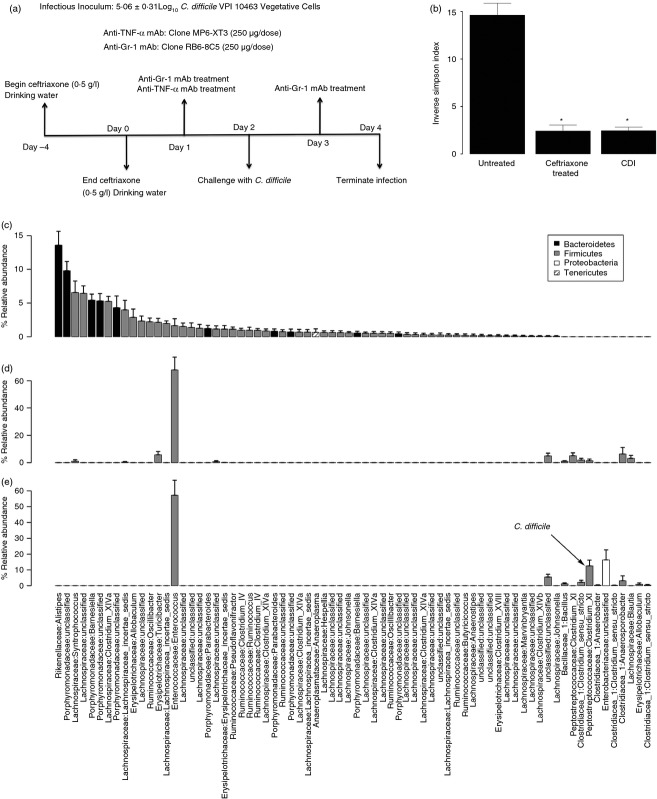
Figure 1.
(a) Experimental approach and timeline. (b–e) Effect of ceftriaxone treatment and Clostridium difficile infection on the colonic microbiota (day 4). (b) Diversity (Inverse Simpson Index) of the mucosa-associated bacterial communities of untreated, ceftriaxone-treated, or ceftriaxone-treated and C. difficile infected mice. (c–e) Relative abundance of the mucosa-associated bacterial communities of the mice in panel b. The operational taxonomic units (OTUs) were ordered by decreasing abundance of genera in the untreated group. Data are shown as mean ± SEM relative abundance. The Family and Genus-level taxonomies are displayed along the x-axis and the Phylum-level taxonomy is identified in the shading of individual bars.

