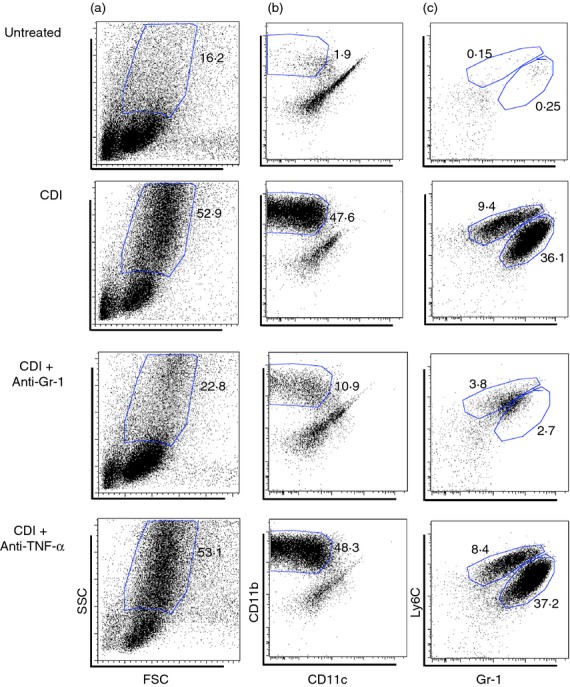
Figure 5.

Flow cytometric analysis of colonic leucocytes from Untreated, Clostridium difficile-infected, C. difficile-infected and anti-Gr-1-treated, C. difficile infected and anti-tumour necrosis factor (TNF-α ) -treated animals (day 4). (a) Analysis of forward-scatter (FSC) and side-scatter (SSC) properties of total colonic CD45+ leucocytes. (b) Analysis of CD11b and CD11c expression profiles of SSCHigh FSCLow CD45+ leucocytes as defined in panel (a). (c) Analysis of Ly6C and Gr-1 expression profiles of the CD11bHigh CD11cLow population defined in panel (b). CDI = C. difficile infected. The number in bold type indicates the percentage of total CD45+ leucocytes contained within the indicated gate.
