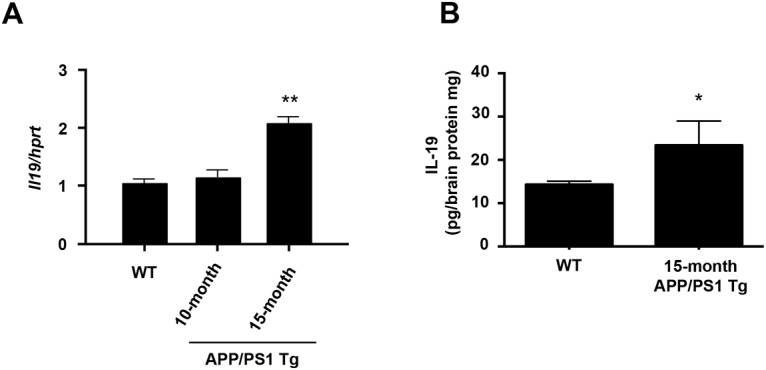
Fig 6. In a mouse model of AD, IL-19 is upregulated in affected regions in association with disease progression.

(A) qPCR data for IL-19 in the hippocampi of APP/PS1 Tg and B6 mice. (B) ELISA data for IL-19 in the hippocampi of APP/PS1 Tg and B6 mice. IL-19 expression level gradually increased as disease progressed. WT, wild-type B6 mice. *, p < 0.01 vs. WT. **, p < 0.001 vs. WT. Values are means ± SD (n = 3).
