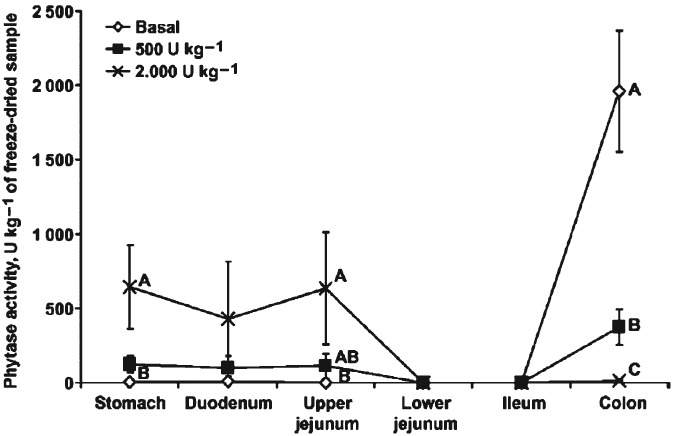
Figure 5.

Phytase activity of digesta from various segments of the gut of pigs fed a basal diet or diets supplemented with 500 and 2000 FTU phytase kg−1. A–C: for each segment, means not sharing a common letter differ (P <0.05). Graph adapted from Pagano et al.63
