
Figure 2.
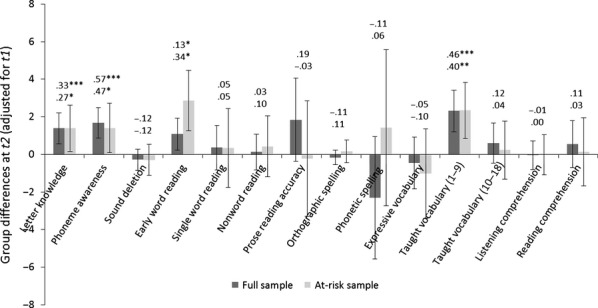
Relative advantage for the Experimental versus Control group in t2 marginal mean scores on language and literacy outcomes (with 95% confidence intervals). Effect sizes are above the bars; uppermost values refer to the full sample, lowermost to the at-risk subsample. Note: The y-axis for letter knowledge and phonetic spelling represents instead the average difference in raw score gains across t1 and t2 between the groups