
Figure 5.
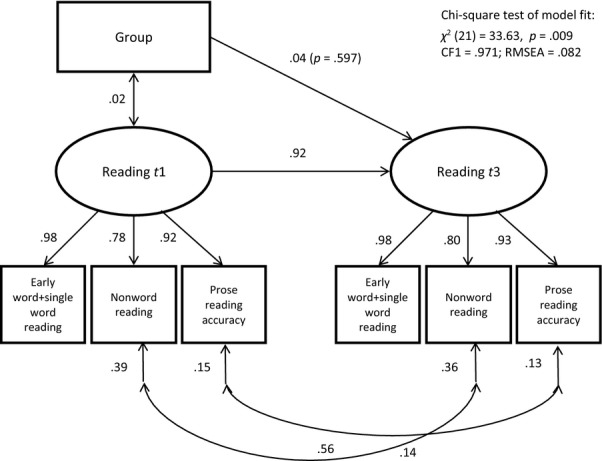
A path model for the full sample showing the effect of ‘group’ (proxy for intervention) on the latent variable ‘reading’ at t3, controlling for reading at t1
Official websites use .gov
A
.gov website belongs to an official
government organization in the United States.
Secure .gov websites use HTTPS
A lock (
) or https:// means you've safely
connected to the .gov website. Share sensitive
information only on official, secure websites.
A path model for the full sample showing the effect of ‘group’ (proxy for intervention) on the latent variable ‘reading’ at t3, controlling for reading at t1