Figure 2.

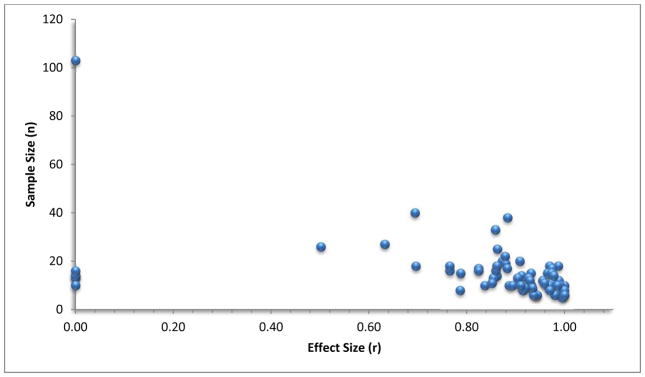
Funnel plot of Pearson’s r by sample size for each study (n=74). This funnel plot shows the ‘classic’ funnel plot asymmetry, with small, non-significant studies absent in the available research.

Funnel plot of Pearson’s r by sample size for each study (n=74). This funnel plot shows the ‘classic’ funnel plot asymmetry, with small, non-significant studies absent in the available research.