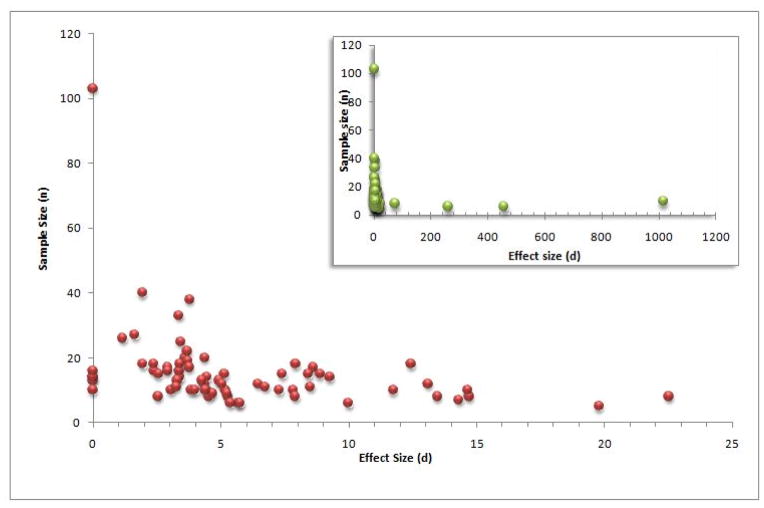
Figure 3.
Funnel plot of Cohen’s d by sample size for studies without extreme values (n= 70). While a ‘large’ Cohen’s d value is usually d >0.8, most of our values are between 1 and 25, with funnel plot asymmetry due to the heavy right-tail evident here. Figure 3 Inset: Funnel plot of Cohen’s d by sample size for each study (n=74), showing the four extreme outlier values.

