
Figure 2. Transcriptional activity and CAR function in persisting cells.
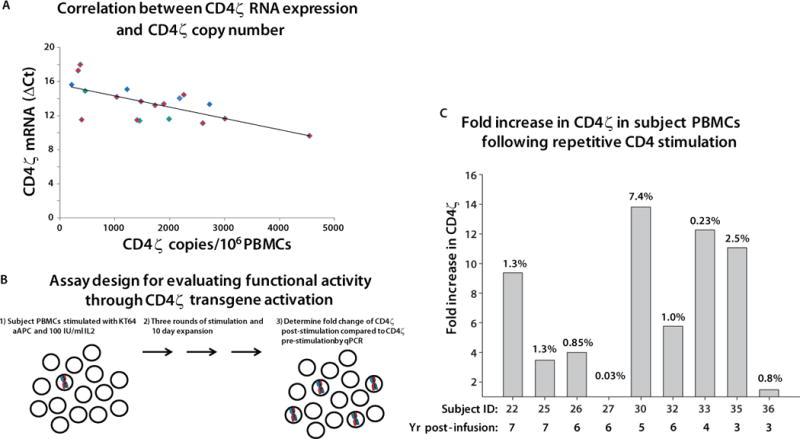
(A) The CD4ζ RNA level (y axis) is plotted versus the number of DNA CD4ζ DNA copies per million PBMC of each tested sample. Samples from the Deeks, Mitsuyasu and Aronson studies are plotted as red, blue and green symbols, respectively. CD4ζ RNA expression was calculated from the ΔCt values for RT-PCR of CD4ζ and GAPDH mRNA. GAPDH is expressed at a high level, so that greater expression of CD4ζ results in a smaller expression difference and so a smaller ΔCt. The values are significantly correlated by linear regression analysis (p=0.0018) testing whether rho=0 or not. No RT-controls were run in parallel and all plotted CD4ζ samples were negative, confirming the signal observed is due to RNA template. Two subjects did not have detectable CD4ζ RNA. (B) Design of the proliferation assay used to interrogate function of CD4-ζ CAR in T-cells. This assay was validated prior to employing as described in Fig. S1. Functionality is measured as the relative increase in the average copy number of CD4ζ cells following anti-CD4 antibody activation over percentage of CD4ζ before stimulation. (C) Fold-increase of CD4ζ expressing cells following three 10-day rounds of anti-CD4 mAb loaded irradiated K562 artificial antigen presenting cells expressing the high affinity Fc Receptor CD64 (KT64) and 100 IU of IL-2. CD4ζ copy numbers were evaluated from the gDNA of subject PBMCs before and after activation by qPCR analysis. The final percentage of CD4ζ in each culture is indicated by the number at the top of each bar. Each bar is designated at the bottom with the subject ID and year post-infusion of the sample.