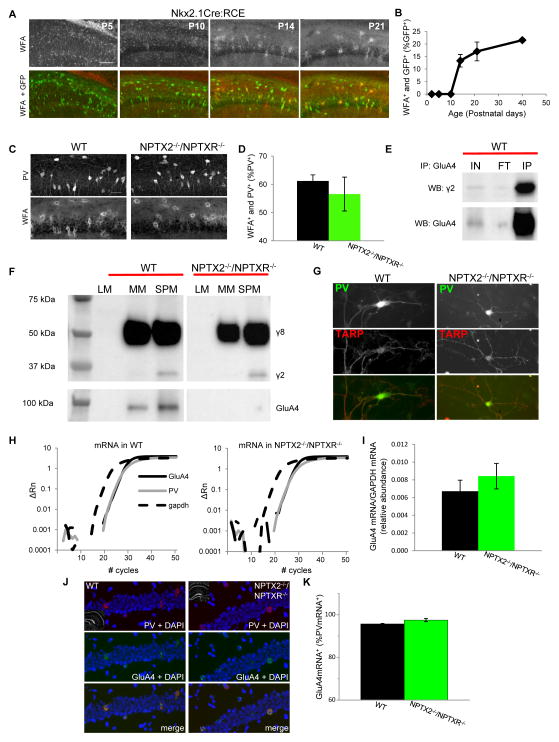
Figure 3. Normal PNN, stargazin, and GluA4 mRNA levels in NPTX2−/−/NPTXR−/− mice.
(A) Representative images of PNN staining with WFA in Nkx2-1-cre:RCE hippocampal sections obtained at the developmental time points indicated (bar 100μm). (B) Group data plot illustrating the time course for PNN formation around GFP+ cells in Nkx2-1-cre:RCE mice. Mice/sections counted: 2/6, P2; 3/3, P5; 2/6, P10; 3/5 P14; 2/6 P21; and 3/5 P40. (C,D) Representative images (C) and group data (D) illustrating the co-localization of PNNs and PV+ cells in hippocampal sections obtained from P21-30 wild type and NPTX2−/−/NPTXR−/− mice (bar 35μm). Mice/sections counted: 5/5, WT; 2/5, NPTX2−/−/NPTXR−/−. (E) Representative immunoblots illustrating that pull-down of GluA4 from hippocampal synaptic plasma membranes co-precipitates stargazin (γ2) as well as GluA4 itself (IP lanes). Also shown are the input (IN) and flow through (FT) materials probed with the same antibodies (comparing FT/IN signals revealed that 55±9% of available SPM stargazin co-precipitated with GluA4, n=4 mice). (F) Representative western blots of the indicated cell fractions from wild type and NPTX2−/−/NPTXR−/− hippocampi probed with an antibody that recognizes stargazin (γ2) and TARPγ8 (γ8; upper blot) or GluA4 (lower blot). SPM stargazin/actin = 0.38±0.06 and 0.34±0.06 for wild type and NPTX2−/−/NPTXR−/− mice respectively, p=0.66, n=3 mice per genotype. (G) Representative images of PV+ cells from wild type and NPTX2−/−/NPTXR−/− mice cultures confirming stargazin/γ8 expression in PV+ cells in both genotypes (scale bar 50 μm). (H) Representative single trial qPCR amplification plots for GluA4 mRNA (solid black), PV (grey), and GADPH (hashed black) from wild type and NPTX2−/−/NPTXR−/− hippocampi. Relative fluorescence intensities (deltaRn) are plotted against PCR cycle numbers on a logarithmic scale. (I) Group data summarizing the abundance of GluA4 mRNA (relative to GADPH) in hippocampi from wild type and NPTX2−/−/NPTXR−/− mice. 3 independent experiments using RNA from 3 independent litters of each genotype were performed. (J,K) Representative sample images (J) and group data summary (K) of wild type and NPTX2−/−/NPTXR−/− hippocampal sections probed for PV and GluA4 mRNA by fluorescent in situ hybridization (bar 50μm). Cells/sections/mice counted: 165/4/2, WT; 196/6/3, NPTX2−/−/NPTXR−/−. See also Figure S1.

