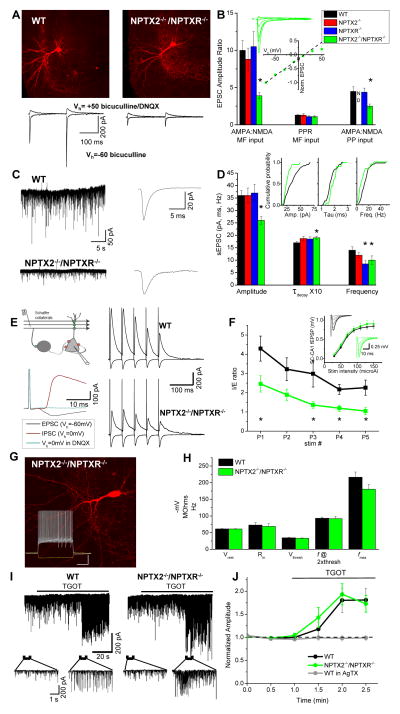
Figure 4. Impaired PVFSI AMPAR function and feedforward inhibition in NPTX2−/−/NPTXR−/− mice.
(A) Representative PVFSIs recorded in wild type and NPTX2−/−/NPTXR−/− mice with corresponding AMPA and NMDA EPSC traces evoked by granule cell stimulation (bars, 100μm). (B) Summary for AMPA/NMDA ratios in PVFSIs at granule cell (MF, n=16cells/8mice, 4cells/4mice, 8cells/5mice, 15cells/7mice for WT, NPTX2−/−, NPTXR−/−, NPTX2−/−/NPTXR−/− respectively; *p=0.00007 vs. WT, Mann-Whitney U test) and medial perforant path (PP, n=15 cells/6mice, 6 cells/3mice, 7cells/3mice for WT, NPTXR−/− and NPTX2−/−/NPTXR−/− respectively; *p=0.02 vs. WT Mann-Whitney U test) inputs for indicated genotypes (PP inputs not determined (ND) for NPTX2−/− mice). Also plotted are PPRs (5Hz) of MF-PVFSI EPSCs. Inset, I–V relation for AMPAR-mediated transmission, and sample traces, at PP inputs to NPTX2−/−/NPTXR−/− PVFSIs (n=5cells/3mice). (C) Representative sEPSC recordings (left) and ensemble average sEPSC (right) recorded in WT and NPTX2−/−/NPTXR−/− PVFSIs. (D) Summary of PVFSI sEPSC properties for the indicated genotypes (n=39cells/16mice, 23cells/8mice, 14cells/7mice, 20cells/9mice for WT, NPTX2−/−, NPTXR−/−, NPTX2−/−/NPTXR−/− respectively; *p=0.002, 0.03, 0.01, and 0.01 for Amplitude, Taudecay, Frequency and Frequency, respectively vs. WT) and cumulative probability plots comparing WT and NPTX2−/−/NPTXR−/− PVFSIs (insets). (E) Schematic (above, left) and sample traces (below, left) illustrating methodology for recording SC-CA1 feedforward inhibition, along with representative sample recordings in wild type and NPTX2−/−/NPTXR−/− mice (right). (F) Group data summary plot of I/E ratios observed using train stimulation in wild type and NPTX2−/−/NPTXR−/− mice (n=10cells/3mice and 9cells/3mice for wild type and NPTX2−/−/NPTXR−/− respectively; p=0.04, 0.005, 0.02, 0.008 for P1,P3,P4,P5 respectively, Mann-Whitney U test). Inset shows SC-CA1 excitatory field potential recording (fEPSP) input-output relations, with traces from representative recordings, for wild type and NPTX2−/−/NPTXR−/− mice. (G) Image of a representative NPTX2−/−/NPTXR−/− dentate PVFSI (bar, 100μm) and associated voltage responses (lower inset) to hyperpolarizing current injection (-200pA) as well as depolarizing current injections peri-threshold (250pA) and twice peri-threshold (500pA) for action potential firing (inset bars, 250ms/20mV). (H) Histogram summarizing resting membrane potentials (Vrest), input resistances (Rin), action potential thresholds (Vthresh), firing frequencies at twice threshold current injection (f @2Xthresh), and maximal firing frequencies (fmax) measured in wild type (n=16 cells/7 mice) and NPTX2−/−/NPTXR−/− (n=9 cells/4 mice) PVFSIs. (I) Continuous traces (upper) from representative CA1 PC recordings in wild type (left) and NPTX2−/−/NPTXR−/− (right) mice illustrating the effects of oxytocin receptor agonist ((Thre4, Gly7)-oxytocin, TGOT) treatment to evoke release from PVFSIs on sIPSCs. Traces below show the indicated regions on an expanded time scale. (J) Summary time course plot of the effects of TGOT on sIPSC amplitudes in wild type (n=6 cells from 3 mice) and NPTX2−/−/NPTXR−/− (n=7 cells from 3 mice) CA1 PCs. sIPSC amplitudes measured during 30s epochs during TGOT treatment were normalized to the average amplitude measured prior to TGOT application. Also plotted is the effect of TGOT in wild type CA1 PCs treated with Omega-Agatoxin (AgTX, 500 nM; n = 4 cells from 2 mice) to prevent release from PVFSIs confirming that TGOT selectively drives sIPSC output from PVFSIs (Hefft and Jonas, 2005; Owen et al., 2013). Values plotted throughout are average±s.e.m. Recordings throughout were made in slices from mice aged P15-P30. See also Figure S2.

