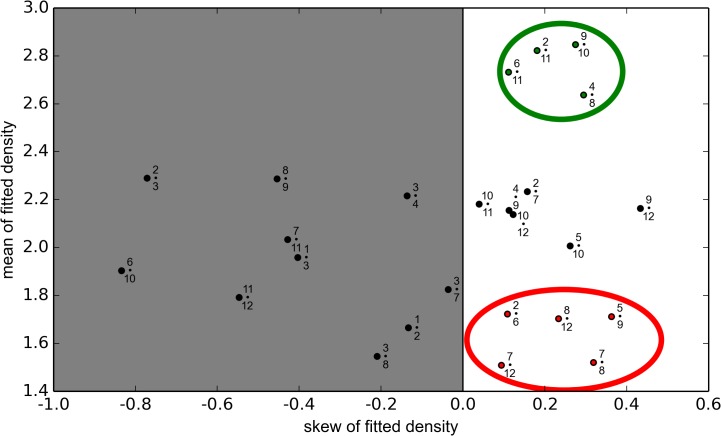
Fig 2. Classification of polyhedral edges as occupied and non-occupied.
A comparison of the density profiles of the sampled long edge connections. The mean of a fitted normal distribution (y-axis) is scattered with a skewness parameter (x-axis). Connections with negative skew are disregarded as no statement about occupancy can be deduced in this case. From the remainder, two groups of four and five connections are identified as occupied (in the green circle) and non-occupied (red circle), respectively. These are used as constraints in the analysis.

