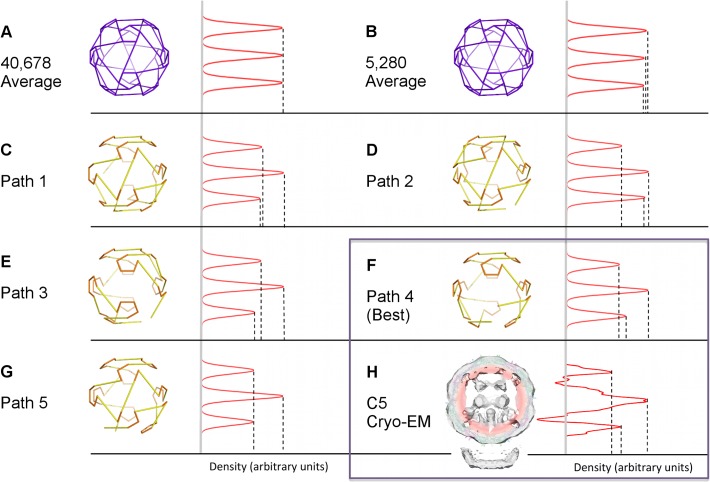
Fig 4. Symmetry averaging identifies Path 4 as the correct solution.
C5-averaged densities in 1-D projection for tomographic data and the path solutions listed in Fig. 3 are compared. The vertical axis shows the radial distance from the centre of the capsid in angstrom, and the horizontal axis corresponds to the C5-averaged density at that radial distance in arbitrary units; density profiles for tomogram and path solutions are normalized by equalizing the maximum densities. Density profiles are shown for: (A) the average of all possible 40,678 Hamiltonian paths; (B) the average of all paths consistent with RNA interaction with the MP; (C-G) the density profiles for the five paths in Fig. 3 individually; (H) the C5 cryo-EM reconstruction from the tomogram, adapted from [20]. Path 4 (cf. Fig. 5A), identical to Path 3 (Fig. 5B) from a geometric point of view but positioned differently within the density with respect to MP, provides the closest fit with the cryo-EM data.

