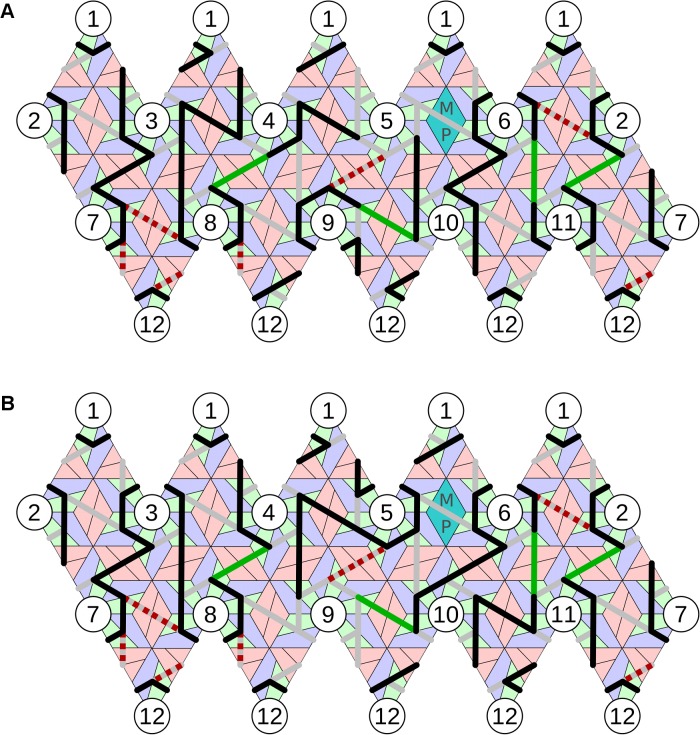
Fig 5. Hamiltonian path solution identified by the method.
(A) The best match with the C5 averaged data (Path 4) starts and finishes at vertex 5 adjacent to the MP (cyan). Following the colouring convention in Fig. 3, red dashed lines show unoccupied and green lines occupied constraints; other occupied connections implied by our analysis are shown in black. The position of TR, the strongest PS, is denoted in yellow [15]; heterodimers are coloured in green-blue and homodimers in pink. (B) An alternative embedding of the same (geometric) path with a different orientation relative to MP. The path (Path 3) starts and finishes at vertex 9; hence the occupation of the connections differs from Path 4 in (A), even though the overall geometry of the path is the same.

