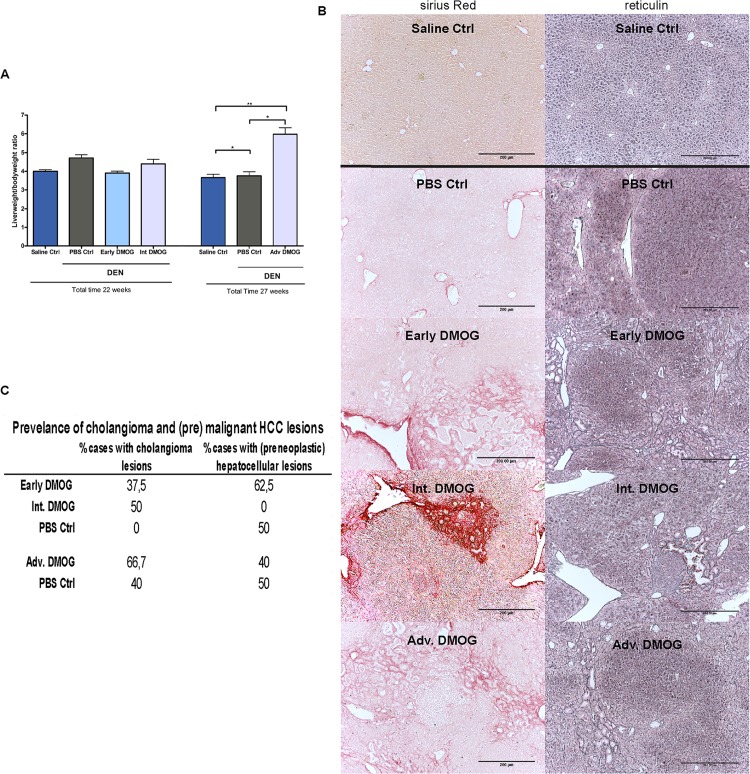
Fig 2. General parameters.
A: Liver/ bodyweight ratios for all groups B: Prevalence of cholangioma and hepatocellular lesions, showing percentage of mice showing one or more cholangioma or (premalignant) HCC lesions C: Representative images of Sirius red and reticulin staining showing cholangioma lesions in all DMOG groups except for PBS control after 22 weeks, and HCC lesions in all DEN groups except for the Int. DMOG group. Scale bars: 200μm, *: p<0,05; **p<0,01. DMOG: dimethyloxaloylglycine; DEN: diethylnitrosamine

