
Fig 2. Individual SF-36 domain scores at baseline and after 4 weeks of treatment with the reformulated product.
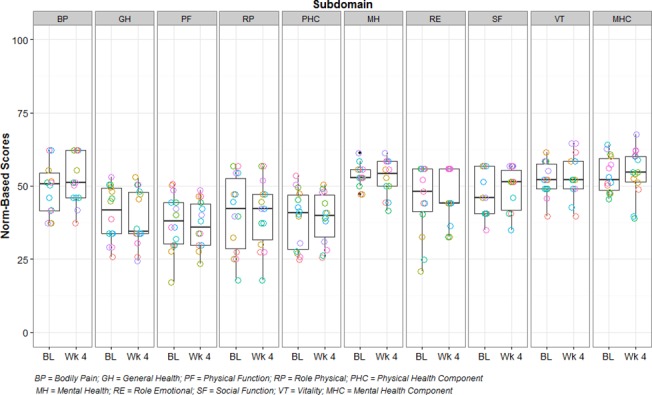
The box plots are schematic box and whisker plots such that the whisker above represents the largest observed value that falls within for the upper fence (3rd quartile + 1.5 * IQR) and the whisker below represents the smallest observed value that falls within the lower fence (1st quartile—1.5 * IQR). IQR = inner quartile range calculated as 3rd quartile value minus 1st quartile value. PF: physical functioning; RP: role physical; RE: role emotional; VT: vitality; MH: mental health; SF: social functioning; BP: bodily pain; GH: general health; PHC: mean physical health component score; MHC: mean mental health component score.