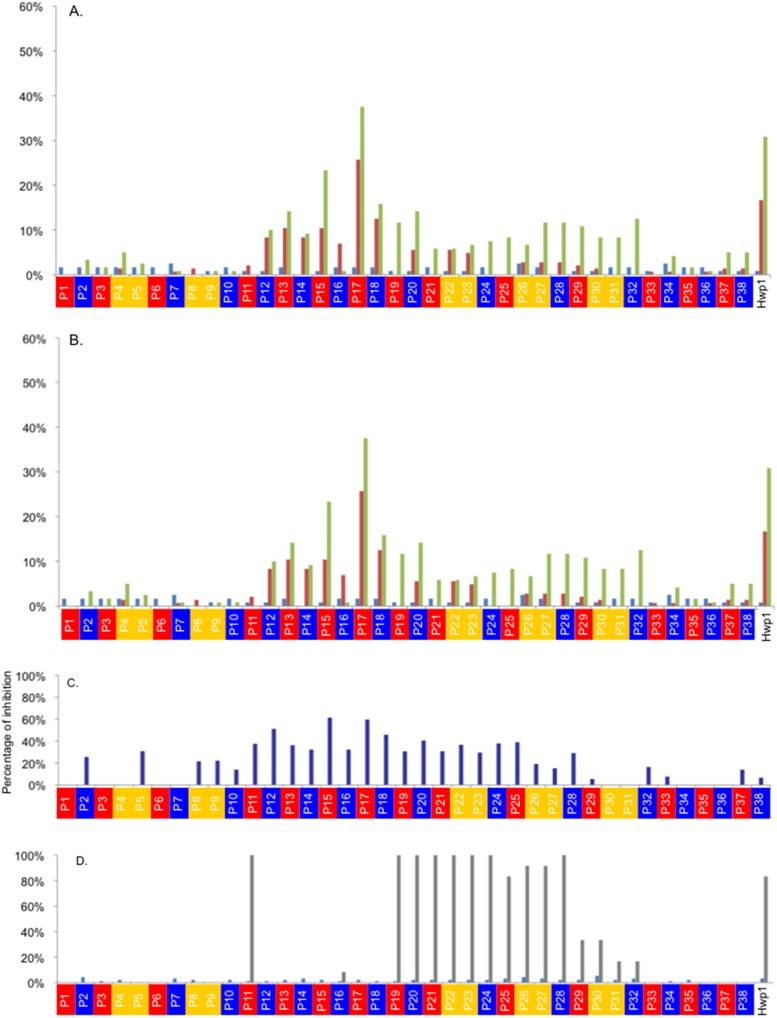
Fig 5. Percentage of sera giving positive IgA (A) and IgG (B) signals, respectively, on the 38 synthetic peptides (with color code according to their design*) as a function of the nature of the sera (CeD in green, CI in red, and HC in blue).
* Red: native peptide; blue all Q changed for E; yellow: combinatory changes for one Q/E (Glutamine/Glutamic acid). (C) Reduction of signal resulting from the addition of 10-5 M of a 20-mer sequence mimicking γ gliadin (γ III) to different Hwp1 peptides. (D) Nature of Hwp1 peptides reacting with mAb 16B1 (epitope mapping) (HC in blue, Ac16B1 in grey).

