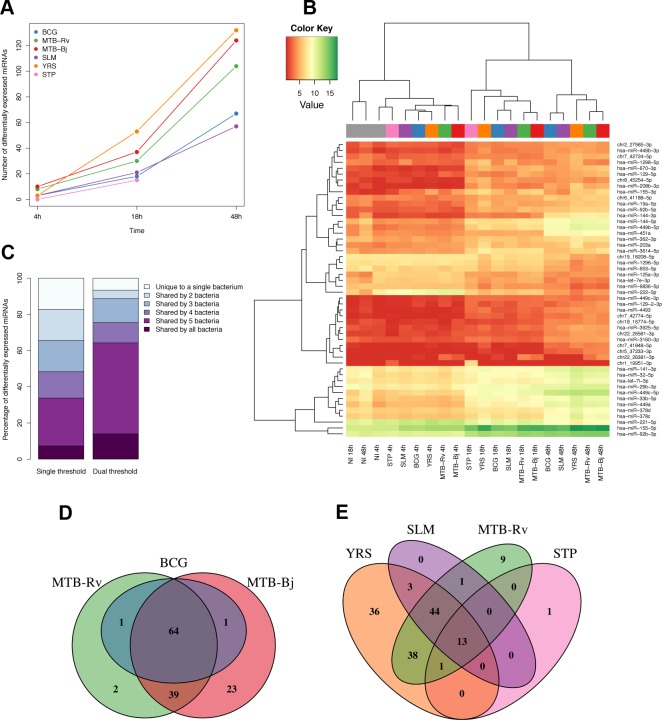
Fig 1. Differential expression of miRNAs in DCs upon infection with a panel of bacteria.
(A) Numbers of significantly differentially expressed miRNAs upon infection at each time point for each bacterium. As we did not have expression profiles for the 48h time point for STP infection, this point is missing from the plot. (B) Heatmap illustrating the hierarchical clustering of experimental conditions based on the mean expression levels of the 50 most variable miRNAs. (C) Overlap of differentially expressed miRNAs between bacteria using two different significance cut-offs. Left-bar shows overlap using a single cut-off of FDR-adjusted p<0.01 and |log2 fold change|>1, while the right bar shows the overlap using a secondary cut-off where a miRNA was called as significant if the absolute log2 fold change was less than 1, if it passed the first more stringent fold-change cut-off upon infection with at least one of the six bacteria. (D and E) Venn diagrams showing the overlap of significantly differentially expressed miRNAs between bacteria of the MTBC (D) and between MTB-Rv and all other non-mycobacterial infections (E).

