
FIG. 6.
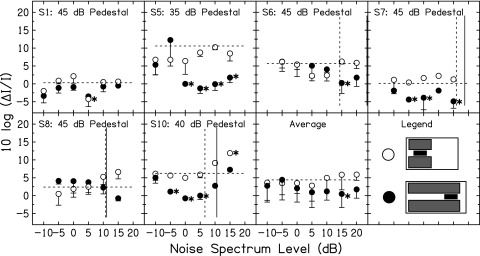
Intensity discrimination results in the simultaneous NN conditions for six listeners and for the average across listeners. For clarity, only the lower portion of the error bars is plotted. Subject number and fixed pedestal level are shown at the top of each panel. The symbol legend is in the bottom right panel. The horizontal dashed lines show WF in quiet (no NN). The asterisks show WFs in NN that were statistically significantly different from the WF in quiet. Vertical lines show masked thresholds for the tone in NN. The dashed vertical line shows threshold in the short NN, while the solid vertical line shows threshold in the long NN. Due to time constraints, these thresholds could not be measured for S1 and S5.