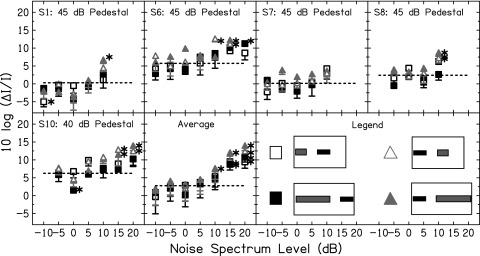
FIG. 9.

Intensity discrimination results in forward and backward NBN conditions for five listeners and for the average across listeners. Subject number and fixed pedestal level are shown at the top of each panel. The symbol legend is at the bottom right of the figure. The dashed lines show WF in quiet. Asterisks indicate WFs with NBN that were statistically significantly different from WF in quiet.
