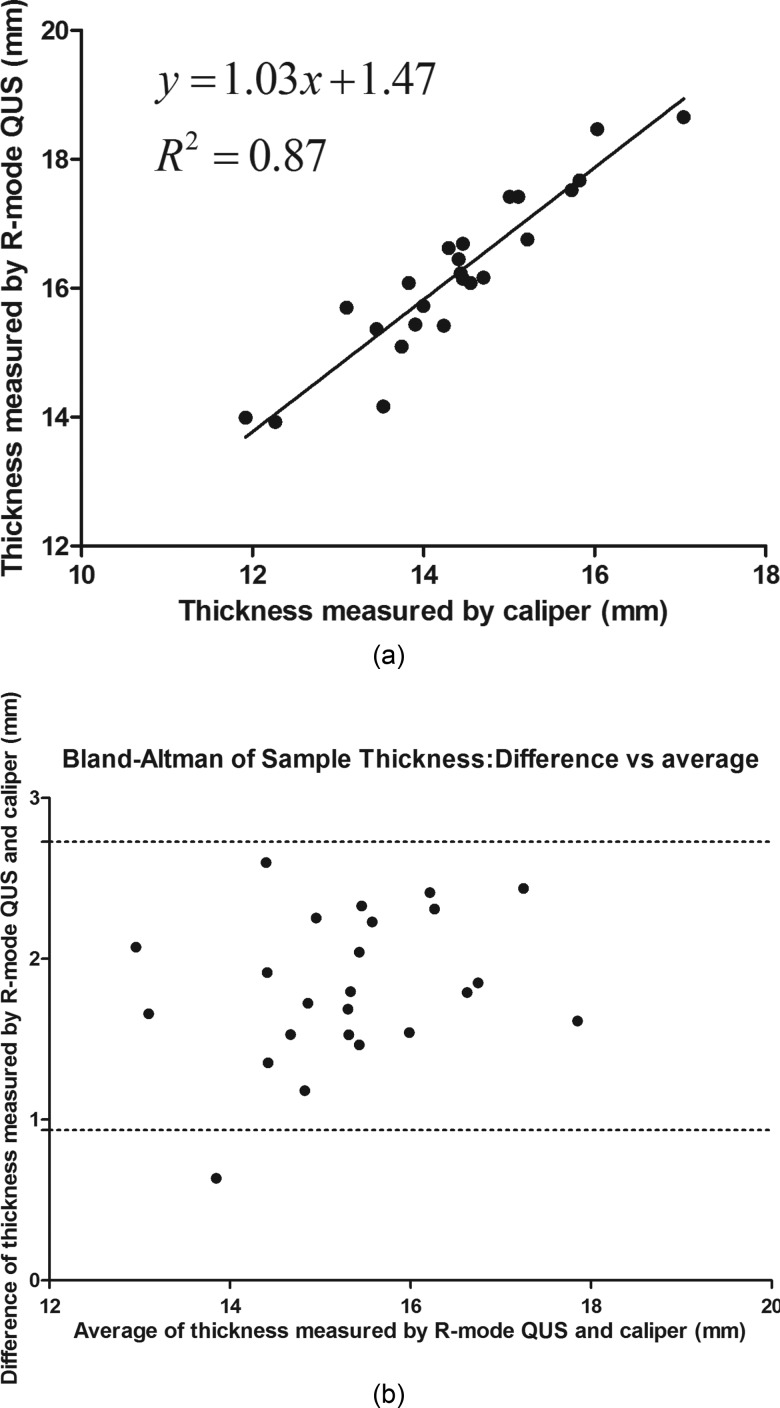
FIG. 4.
(a) Linear regression analysis of the sample thickness measured by caliper and reflection mode QUS shows high linear correlation (R2 = 0.87). (b) Bland–Altman analysis of the difference and average of the thicknesses measured by caliper and R-mode QUS. The bias between two measurements is 1.83 mm and the standard deviation of bias is 0.46. The upper limit of the 95% agreement is 2.73, and the lower limit is 0.93.

