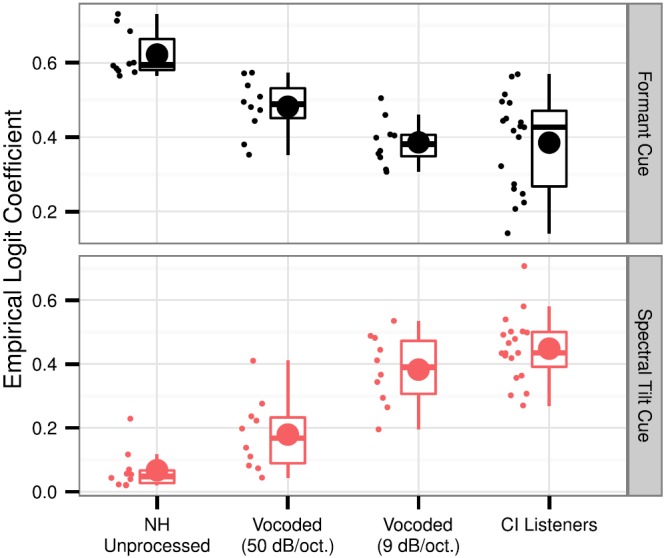
FIG. 7.

(Color online) Boxplots showing empirical logit coefficients for individuals in each listening condition. The upper panel shows coefficients for the formant cue, and the lower panel shows coefficients for the spectral tilt cue. Lower and upper edges of boxes reflect the 25% and 75% inter-quartile range. Upper and lower whiskers reflect the median ±1.58 * the interquartile range/square root (n). Median levels are represented by the horizontal line crossing each box, and mean levels are represented by the large circles. Individual levels are represented by small circles.
