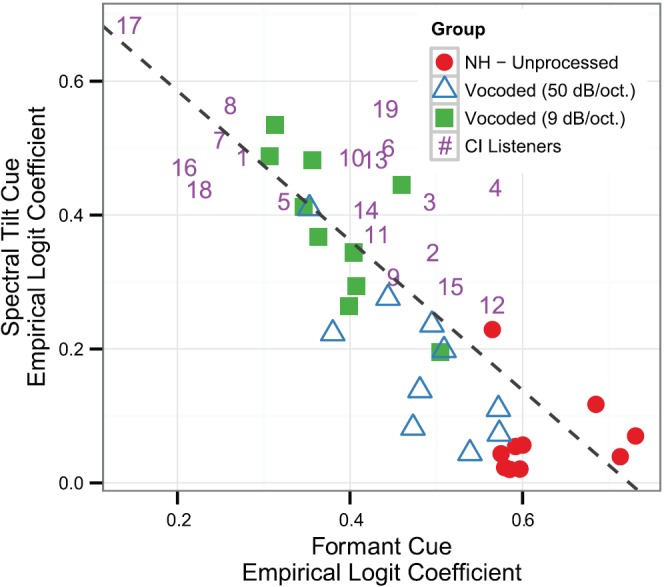
FIG. 8.

(Color online) Scatterplot of empirical logit coefficients for formant cues (x axis) and spectral tilt cues (y axis) for each listener group. NH listeners in different conditions are represented by different shapes, while CI listeners are represented by unique subject numbers that correspond to the demographic table (Table I). Across all listener groups, higher formant cue coefficients are typically accompanied by lower spectral tilt coefficients, and vice versa.
