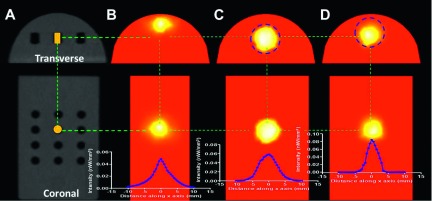
FIG. 8.

BLT reconstruction result. The transverse and coronal CBCT slices are shown in (A), with the Trigalight bioluminescence source marked with an orange rectangle and circle. The BLT reconstruction was performed with no region of interest (ROI) constraint (B), with an 8 mm diameter spherical ROI centered at the source position (C), and with the constraint ROI shifted up by 2 mm (D), respectively. The vertical axis is the source intensity in units of nW/mm3.
