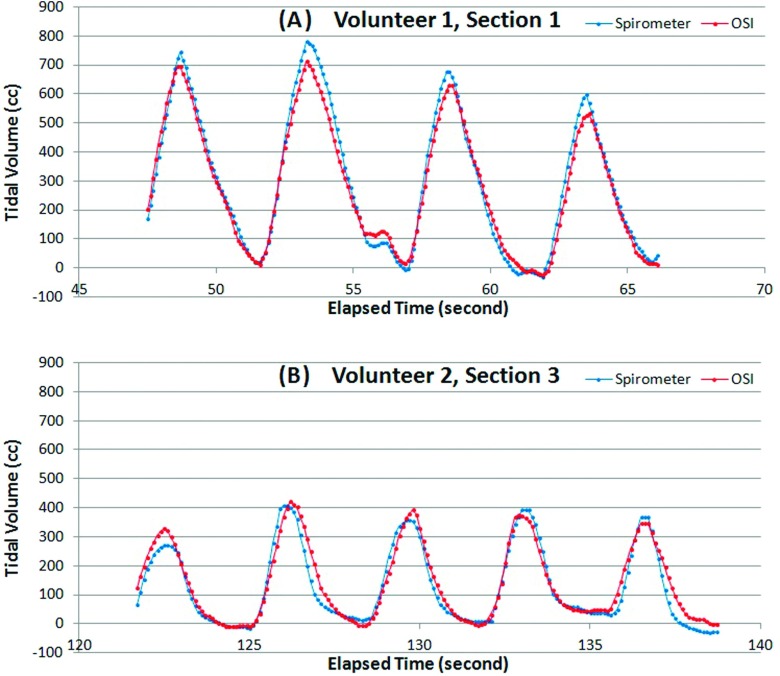
FIG. 6.
Comparison of the dynamic tidal volume measured by spirometer and OSI. (A) and (B) are two breathing tidal volumes for two of the volunteers (1 and 2). The spirometry curves (blue) were baseline corrected within a consecutive five breaths (the double dips before the last cycle in volunteer 1 was picked by the online correction program as two cycles, which did not affect the baseline correction).

