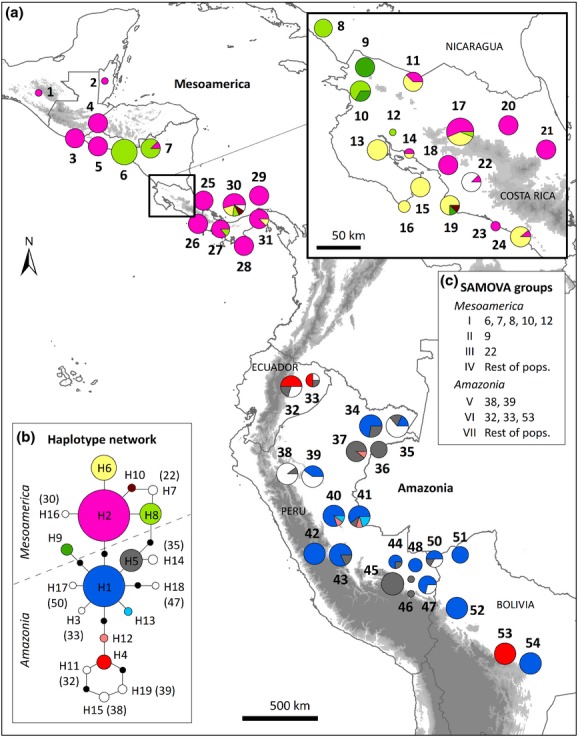
Figure 2.

(a) Haplotype distribution, (b) haplotype network, and (c) SAMOVA groups of trnH–psbA sequences for Ficus insipida subsp. insipida populations sampled from 54 sites in Mesoamerica and Amazonia. Haplotype distributions at the border between Costa Rica and Nicaragua are shown separately. Pie charts are labelled with population numbers as shown in Table1. Colours represent the haplotypes (H1–H19). In the haplotype network (b), haplotypes unique to a single population are shown in white with population number given in brackets. Circle size is proportional to sample size for each population (n = 1–16 individuals) and for each haplotype (n = 1–119 individuals). Missing haplotypes in the network are shown as black dots, and a dashed line separates haplotypes of each region. The Andean Cordillera and other mountains are shown in shaded grey.
