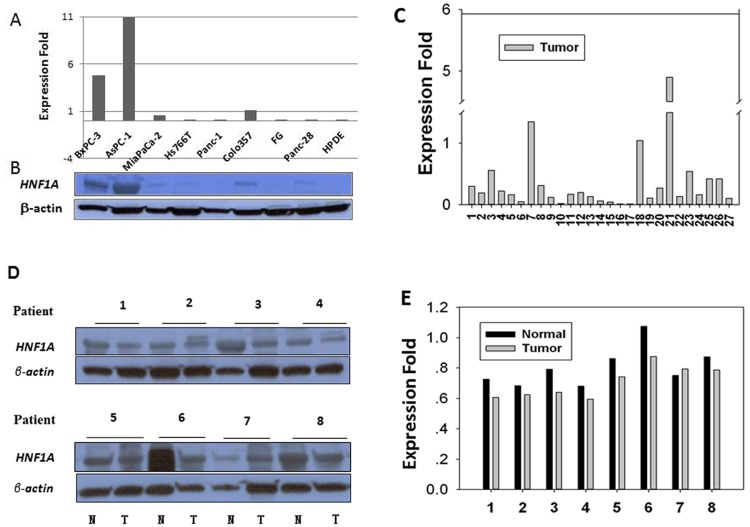
Fig 1. HNF1A expression in human pancreatic carcinoma cell lines (A and B), and human pancreatic tissues (C and D).
A, mRNA expression level in human pancreatic cancer cell lines relative to control cell line COLO357 as measured by qRT-PCR. B, protein expression in corresponding cell lines by Western blot. C, fold differences in mRNA expression levels of 27 pancreatic tumors compared to their paired adjacent non-tumor tissues. D and E, Western blots and quantitative measurement of expression of HNF1A protein in eight paired human pancreatic tumors samples (T) and their adjacent non-tumor (N) tissues. The expression levels of HNF1A are normalized to those of β-actin.

