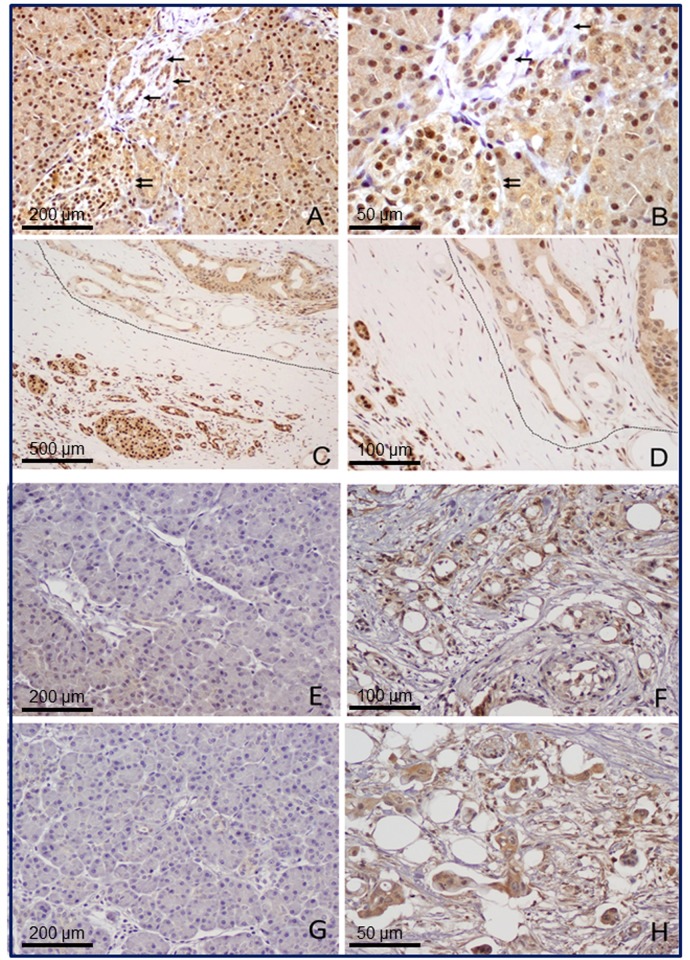
Fig 2. Representative micrographs of HNF1A, pAKT, pmTOR in PDAC cancerous tissue or its surrounding non-tumor tissue by immunohistochemistry.
Images (A and B) show cytoplasmic and nuclear expression of HNF1A in normal pancreatic tissue. The normal pancreatic ducts are marked with single arrow. Islet cells are marked with double arrows. Pancreatic islet cells have higher level of HNF1A expression than acinar and ductal cells. Images (C and D) show the expression of HNF1A in pancreatic ductal adenocarcinoma (circled) and benign pancreatic ductal cells and islet cells adjacent to the tumor (left). Panel E-H show the representative micrographs for p-AKT (E and F) and p-mTOR (G and H) expression in normal pancreatic tissues (E and G) and pancreatic ductal adenocarcinoma (F and H). Magnifications: 100X for A, E and G; 400X for B and H, 40X for C, 200X for D and F.

