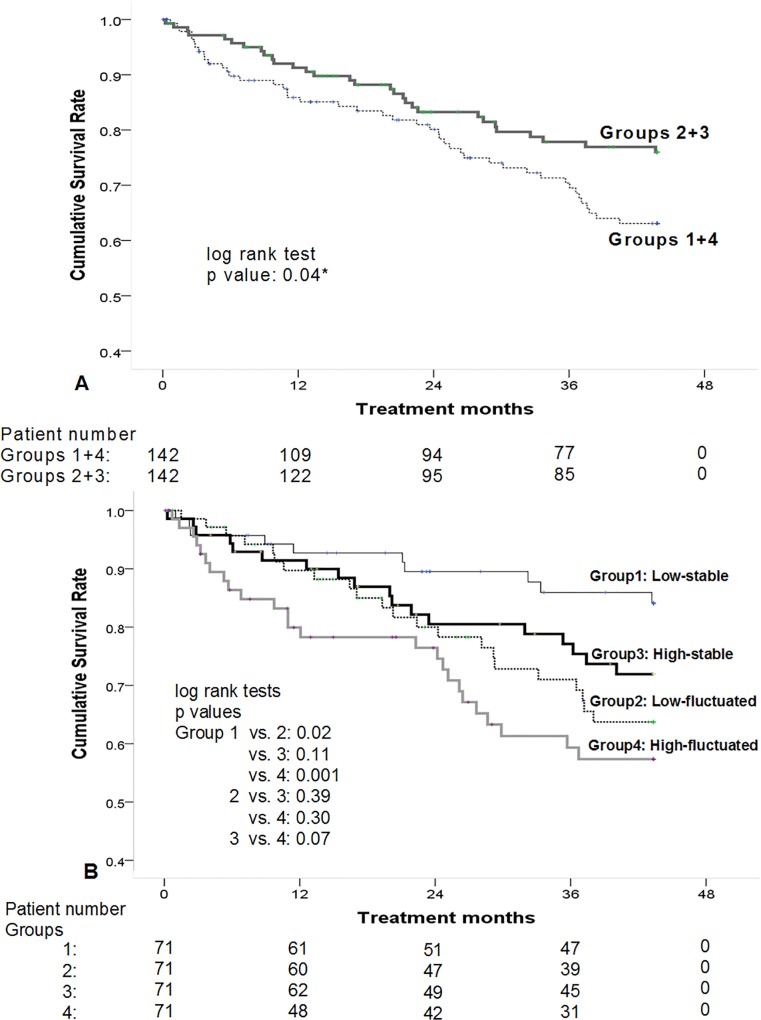
Fig 4. Survival differences among 4 groups.
(A) By Kaplan-Meier analyses, Group 2+3 showed a higher cumulative survival rate than those with high fluctuation (i.e., Groups 1+4) (p = 0.04). (B) According to the medians of baseline hs-CRP/Alb and standard deviation of hs-CRP/Alb, total patients were re-divided into four groups. Low-stable group had a better survival than the low-fluctuated (p = 0.02), and high-fluctuated groups (p = 0.001). However, there were no significant survival differences between the high-stable, low-fluctuated, and high-fluctuated groups.

