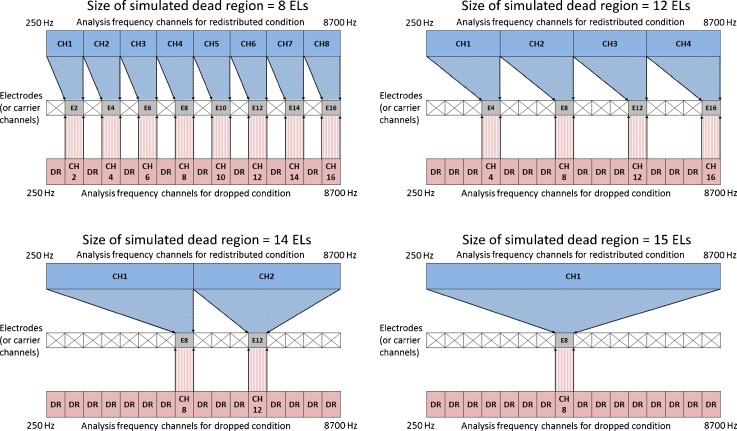
Fig. 1.
Two different frequency remapping conditions with simulated dead regions. In the redistributed condition shown in blue, incoming sound was analyzed through 8, 4, 2, or 1 channels of bandpass filters spanning between 250 and 8700 Hz, depending on the testing conditions. Thus, for the redistributed conditions, the number of analysis channels decreased as the size of dead regions increased. Spectral information for each channel was then assigned to stimulating electrodes. In the dropped condition shown in red, incoming sound was always analyzed through 16 channels of bandpass filters. Spectral information for each channel was assigned to each electrode. However, spectral information for the electrodes corresponding to the locations of simulated dead regions was dropped (indicated as “DR” in the figure) by setting those electrodes inaudible. The gray squares represent enabled or audible electrodes for the redistributed and dropped conditions, respectively. The symbol “×” represent the locations of simulated dead regions. Note that the same analysis frequency channels and all 16 stimulating electrodes were enabled and audible for the “no-dead region” condition both for the redistributed and dropped conditions. Also note that “dead region size” refers to the aggregated size of dead regions along the length of the cochlea for each experimental condition.

