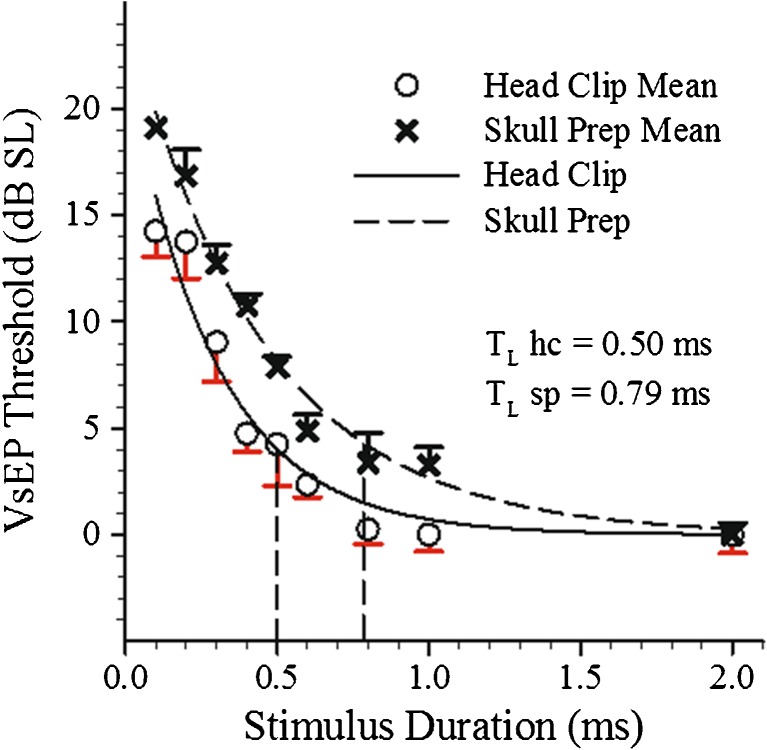
FIG. 7.
Composite plots for thresholds (mean and standard error) at nine stimulus durations for head clip (OPEN CIRCLES) and skull prep (Xs) coupling methods. LINES through data are exponential fitted curves: Y = Ae−ωt, where ω is the angular frequency associated with the fitted curves. DASHED CURVE represents skull prep and SOLID CURVE head clip coupling. TWO DASHED VERTICAL LINES mark the stimulus durations where threshold was increased by 3.98 dB above best threshold thus defining TL for each coupling method. Long time constants for head clip preparation (TL hc = 0.50 ms) and skull preparation (TL sp = 0.79 ms) corresponding to 318 and 201 Hz, respectively.

