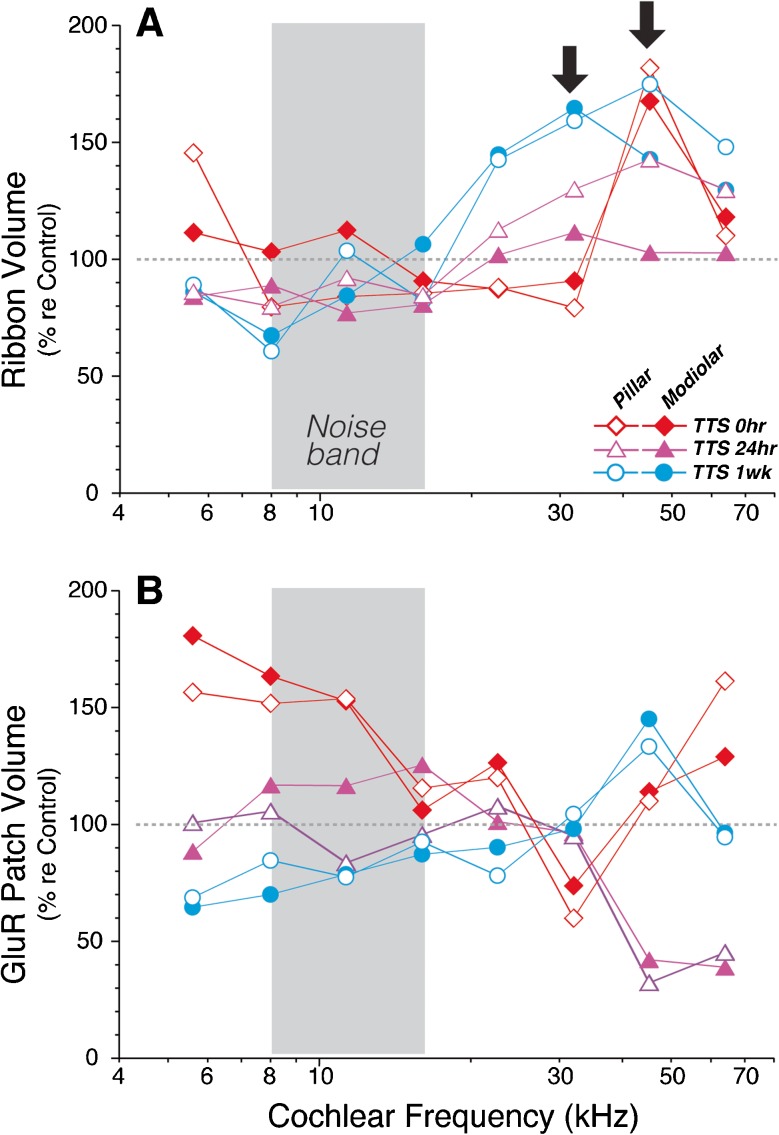
FIG. 11.
Ribbons are larger immediately after acoustic overexposure and remain enlarged for at least 1 week. The volumes of ribbons (A) and gluR patches (B) were compared after vs. before acoustic overexposure. Each point represents a single ensemble average across all the z-stacks at a given frequency region from all the ears in a given group. Data are from round 2 only (same as in Fig. 6): four ears from each exposure group along with the two control ears batch-processed with them. Mean volumes in exposed ears are compared to the means in the matched controls. The frequency region of the noise band is indicated by the gray box, and the region of maximum noise-induced synaptic loss is indicated by the arrows (32 and 45 kHz).

