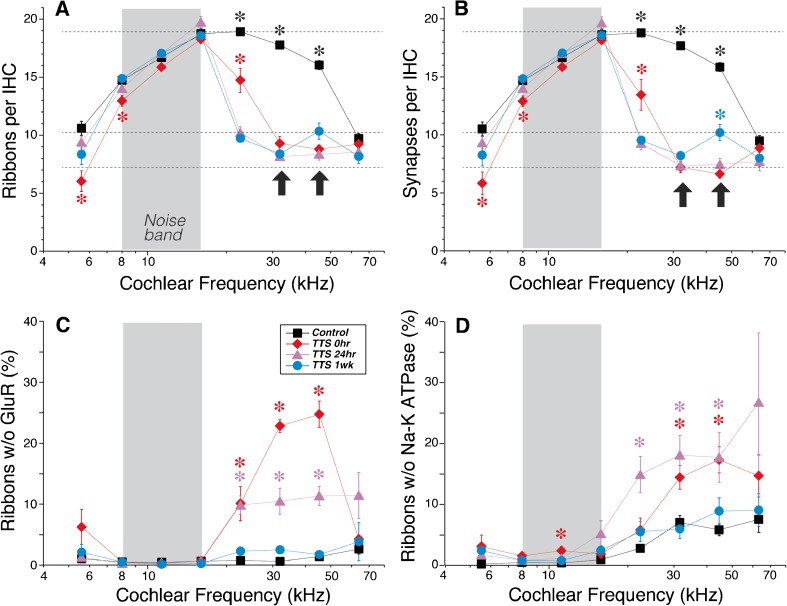
FIG. 6.
Orphan ribbons are common immediately after exposure but disappear by 1-week post-exposure. A, B Ribbon counts and synaptic counts, respectively, at 0 and 24 h and 1 week after exposure to 8–16 kHz noise (gray boxes) compared to control (unexposed) ears. Values are mean counts per IHC (±SEMs). Synaptic counts are slightly lower than ribbon counts because some ribbons are orphans, lacking apposed glutamate receptor patches. Dashed lines are placed at arbitrary y-axis values to facilitate comparison between ribbon and synaptic counts. C Prevalence of ribbons without apposed gluR patches in the same groups as A and B, expressed as the percentage of total ribbon counts. D Prevalence of ribbons without apposed terminals, seen via Na-K ATPase immunostaining, and expressed as the percentage of total ribbon counts. Data are from two z-stacks at each frequency region in each ear, where each z-stack contains 9–12 IHCs, as shown in Fig. 4A. Ears included here (n = 6 for controls and n = 4 for each exposure group) are from round 2 (see “MATERIALS AND METHODS”), i.e., those that were batch-processed and imaged at the same confocal settings. Asterisks indicate significant intergroup differences (p < 0.01): see text for further details. Error bars on some points are hidden by the symbols. Arrows in A and B indicate regions of maximum synaptic loss, i.e., 32.0 and 45.2 kHz.

