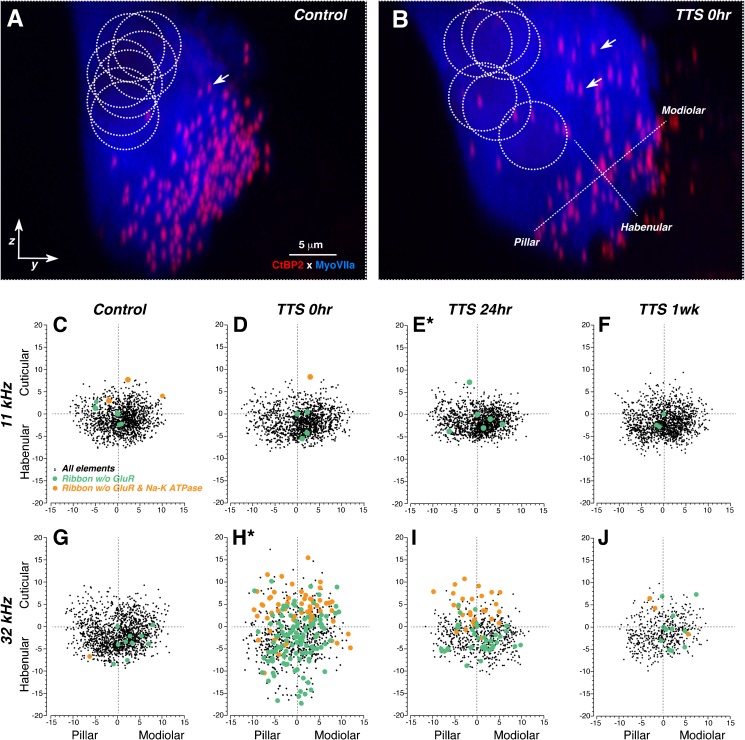
FIG. 7.
Spatial reorganization of IHC synaptic elements after neuropathic noise exposure. A, B Maximum y-z projections of confocal z-stacks from a control (A) and a 0-h post-exposure ear (B), showing the transient dispersion of synaptic elements around the IHC immediately after exposure. Positions of IHC nuclei, shown by the dashed circles, are visible after adjusting the gamma in the red channel (not shown). Positioning of modiolar-pillar and habenular-cuticular axes (used to transform the synaptic locations for superposition across z-stacks, as shown in panels C–J) is shown by the orthogonal dashed lines. Several synaptic ribbons are indicated by white arrows. For the sake of clarity, only the IHC (Myosin VIIa) and ribbon (CtBP2) staining are shown. C–J Scatterplots showing the spatial organization of synaptic elements in control ears (C, G) and in each of the three post-exposure survival groups, as indicated in the column header. The two rows of panels allow comparison of data from cochlear regions tuned to 11 kHz (C–F) vs. 32 kHz (G–J). The new pillar-modiolar and habenular-cuticular axes are defined as illustrated in B. The numerical values are given in microns. As indicated by the key in panel C, each ribbon location is coded according to whether it was paired or unpaired with a gluR patch, or both a gluR patch and a post-synaptic terminal, i.e., Na-K ATPase immunostaining. Plots are derived from the same dataset as that shown in Fig. 6, except that only four control ears are shown, so that the synaptic density can be directly compared to the post-exposure survival groups, each of which also contains four ears. Asterisks next to the panel letters indicate that two distributions (E and H) were significantly different from all the others by an Ansari-Bradley test (Matlab tool box: p = 0.001 and p < 0.00001, respectively).

