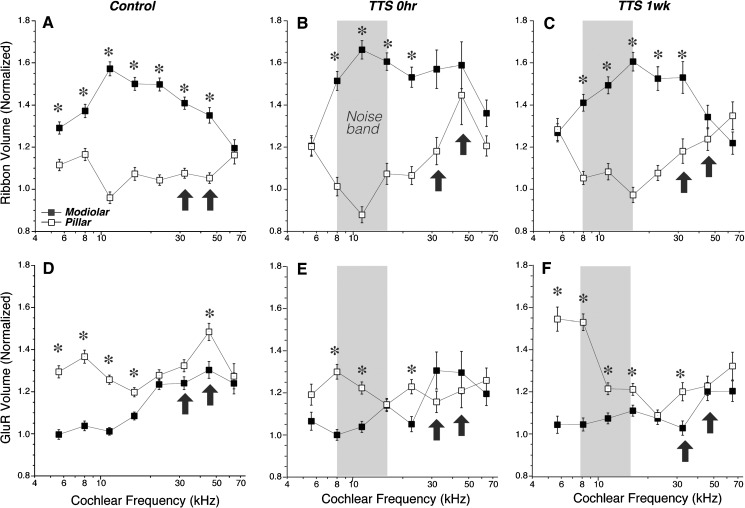
FIG. 9.
The complementary modiolar-pillar gradients in size of ribbons (A–C) and glutamate receptor patches (D–F) are attenuated after acoustic overexposure. In each panel, the mean volume (±SEM) of ribbons or gluR patches is computed after dividing the synapses according to their position re the origin of the transformed modiolar-pillar and habenular-cuticular axes, defined as illustrated in Figure 4B. Volumes in each z-stack are normalized re the median value for that stack. Asterisks indicate that the volume differences are significant at the p < 0.01 level. The bandwidth of the noise exposure is shown by the gray boxes, and the arrows are positioned at the frequency regions with the greatest noise-induced loss of synapses: 32 and 45 kHz. Key in A applies to all panels. Data are derived from the same ears shown in Figure 6.

