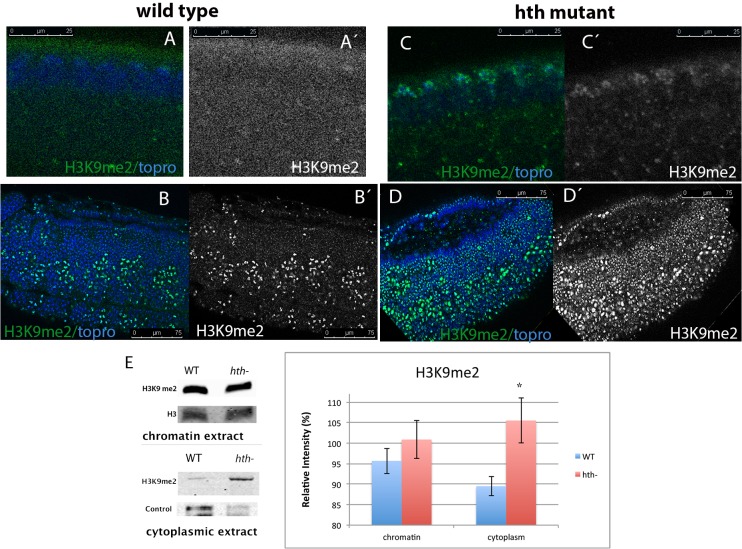
Fig 1. The H3K9me2 methyl mark accumulates in Dfhth mutant embryos.
A-B) Wild type embryo stained with a specific anti-H3K9me2 antibody (green/grey). A, A´) In a cycle 12 wild type embryo the H3K9me2 mark is not detectable. B, B) In a germ band extended embryo (stg. 11) the H3K9me2 mark is present at high levels in the mitotic nuclei. C-D) Dfhth mutant embryo stained as in A. C, C´) Accumulation of H3K9me2 starts to be observed as early as in cycle 11 mutant embryos. D, D´) The H3K9me2 methyl mark is detected at high levels throughout a germ band extended mutant embryo. The mark accumulates in all the nuclei, not only in the mitotic ones. In all figures, embryos are oriented with the anterior to the left and dorsal up. (Embryos were staged as in [61]). E) Western blot analysis of chromatin and cytoplasmic embryonic extracts shows that Dfhth embryos have increased levels of H3K9me2 in the cytoplasm, whereas the chromatin bound H3K9me2 does not change with respect to wild type embryos. The western blot was performed three times and with three different sets of extracts to quantify the signal. Quantification is shown in the graph (p-value: 0,02454258 for the cytoplasmic extract and p-value: 0,09575181 for the chromatin extract. They were calculated using the T-Test). Error bars in the graph show the standard deviation. Controls are anti-H3 for the chromatin extract and anti-α-Tubulin for the cytoplasmic extract. Band quantification was done using ImageJ.

