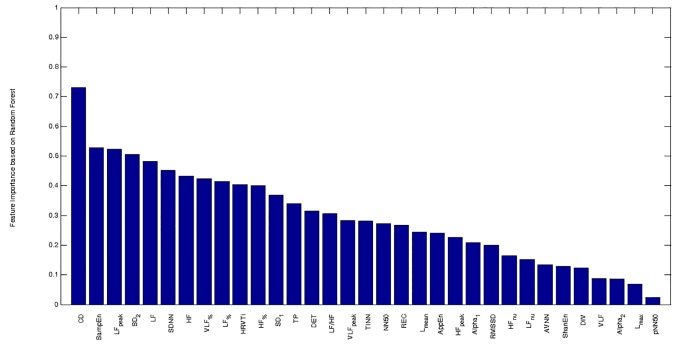
Fig 1. Feature importance computed by using Random Forest algorithm.
CD: Correlation dimension. SampEn: Sample entropy. LFpeak: peak frequency of LF band. SD2: long-term variability in Poincaré Plot. LF: absolute power in low frequency band (0.04–0.15 Hz). SDNN: standard deviation of all RR intervals. HF: absolute power in high frequency band (0.15–0.4 Hz). VLF%: relative power in very low frequency band (0–0.04 Hz). LF%: relative power in low frequency band (0.04–0.15 Hz). HRVTi: HRV triangular index. HF%: relative power in high frequency band (0.15–0.4 Hz). SD1: short-term variability in Poincaré Plot. TP: total power. DET: determinism. LF/HF: the ratio between LF and HF. VLFpeak: peak frequency of VLF band. TINN: triangular interpolation of RR interval histogram. NN50: number of differences between adjacent RR intervals that are longer than 50 ms. REC: recurrence rate. Lmean: mean length of lines in recurrence plot. AppEn: Approximate Entropy. HFpeak: peak frequency of HF band. Alpha1: short-term fluctuations in Detrended Fluctuation Analysis. RMSSD: square root of the mean of the sum of the squares of differences between adjacent RR intervals. HFnu: power in high frequency band (0.15–0.4 Hz), expressed in normalized unit. LFnu: power in low frequency band (0.04–0.15 Hz), expressed in normalized unit. AVNN: Average of all RR intervals. ShanEn: Shannon Entropy. DIV: Divergence. VLF: absolute power in very low frequency band (0–0.04 Hz). Alpha2: long-term fluctuations in Detrended Fluctuation Analysis. Lmax: maximal length of lines in recurrence plot. pNN50: percentage of differences between adjacent RR intervals that are longer than 50 ms.

