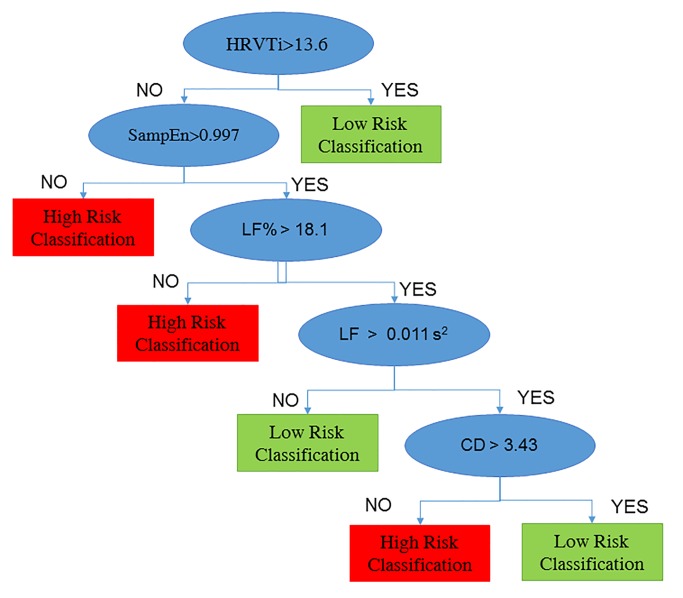
Fig 3. Decision tree for prediction of vascular events.
The decision tree shows the set of rules adopted for classify high and low risk subjects: if HRVTi is higher than 13.6, the subject is classified as low risk, otherwise if SampEn lower than 0.997 or LF% lower than 18.1%, the subject is classified as high risk. The remaining subjects (with higher SampEn and LF%), are classified based on LF and CF: as high risk, if LF is higher than 0.001 s2 and CD is lower 3.43, otherwise as low risk. HRVTi: HRV Triangular Index. SampEn: Sample Entropy. LF: Low Frequency. LF%: Low Frequency expressed as percentage of Total Power. CD: correlation dimension.

