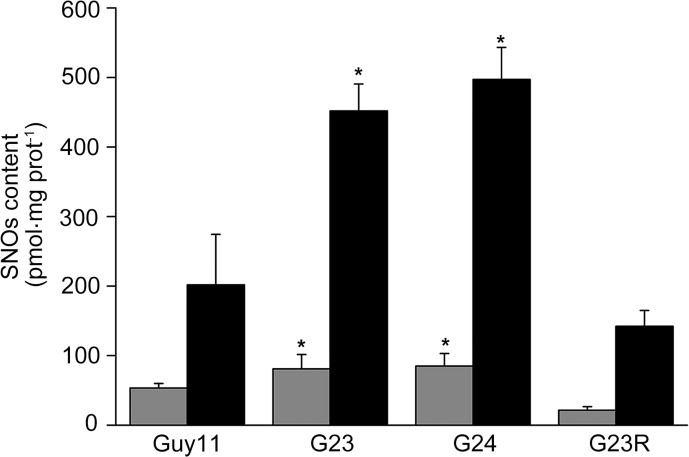
Fig 3. The levels of SNOs in the tested M. oryzae strains.
Total intracellular SNOs content in mycelia cultured in liquid CM in the dark at 28°C for 3 days without (gray bar) or with 100 μM SNP treatment (black bar). The values obtained were compared to a standard curve constructed using GSNO. The results were normalized to the protein content by a Bradford assay. The experiments were performed in triplicate. Error bars represent SD. Asterisks in each data column indicate significant differences at p = 0.05.

