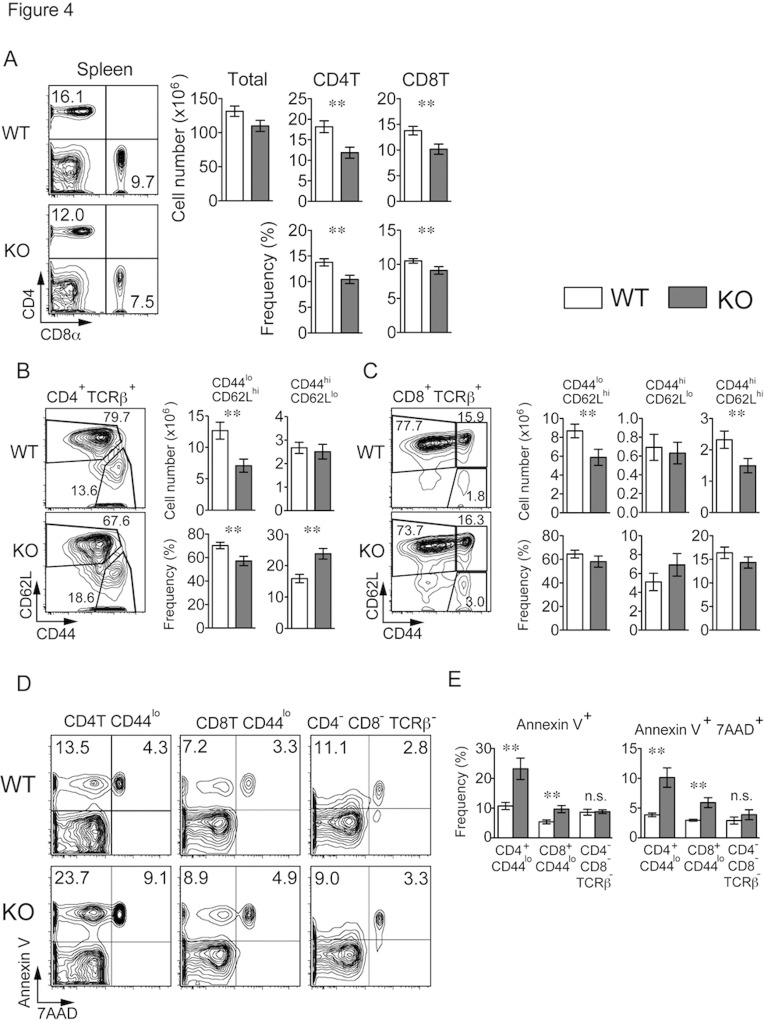
Fig 4. Decreased naive CD4 and CD8 T cells with increased apoptosis in Rasal3-KO mice.
(A) Flow cytometry profiles for CD4 and CD8 of splenocytes from WT and Rasal3-KO mice (left). The bar graphs show the number of total splenocytes and number and frequency of splenic CD4+ TCRβ+ and CD8+ TCRβ+ cells (n = 19 mean ± s.e.) (right). (B and C) Profiles of CD44 and CD62L in splenic CD4+ TCRβ+ (B) or CD8+ TCRβ+ (C) cells (left). The bar graphs show the number and frequency of naive (CD44lo CD62Lhi) cells, effector memory (CD44hi CD62Llo) cells and central memory (CD44hi CD62Lhi) cells (n = 17, mean ± s.e.) (right). (D) Annexin V and 7AAD staining of CD4+ TCRβ+ CD44lo, CD8+ TCRβ+ CD44lo and CD4- CD8- TCRβ- spleen cells freshly isolated from WT or Rasal3-KO mice. (E) The bar graphs show the frequency of Annexin V+ 7AAD- and Annexin V+ 7AAD+ cells depicted in panel D (n = 5, mean ± s.e.).

