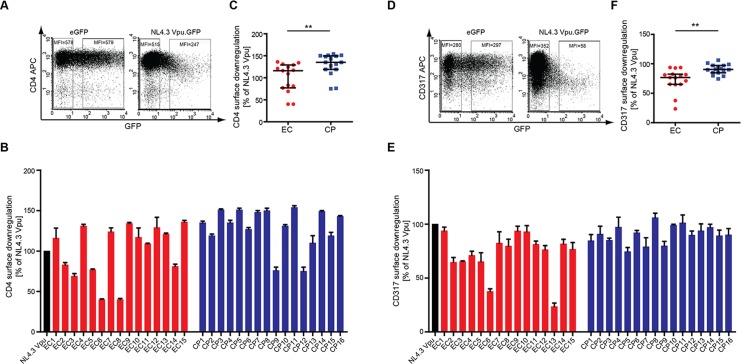
Fig 2. CD4 and CD317/tetherin downregulation by patient-derived Vpus.
Surface CD4 and CD317/tetherin levels were analyzed by flow cytometry on A3.01cells 48 h post transfection with the indicated Vpu.GFP expression constructs. A) Representative flow cytometry dot plots of gated living cells for CD4-APC (y-axis) vs. GFP (x-axis). The MFI (Y Geo Mean) of untransfected (left gate) and medium to high GFP-expressing (right gate) cells is indicated. CD4 cell surface levels of transfected cells were normalized to untransfected cells in the same sample by calculating the ratio of the MFIs of left and right gates and expressed relative to that of NL4.3 Vpu that was arbitrarily set to 100%. B) CD4 cell surface levels of A3.01cells expressing patient-derived Vpu proteins relative to NL4.3 Vpu. Shown are mean values of triplicate transfections with the indicated standard deviation. The result is representative of three independent experiments. C) Comparison of CD4 cell surface levels in A3.01 cells expressing EC or CP Vpu alleles. Statistical significance was assessed using two-tailed Mann-Whitney U-Test (p = 0.02), bars represent median and interquartile ranges. D) Representative flow cytometry dot plots of gated living cells for CD317/tetherin-APC (y-axis) vs. GFP (x-axis). The MFI (Y Geo Mean) of untransfected (left gate) and medium to high GFP-expressing (right gate) cells is indicated. CD317/tetherin cell surface levels of transfected cells were normalized to untransfected cells in the same sample by calculating the ratio of the MFIs of left and right gates and expressed relative to that of NL4.3 Vpu that was arbitrarily set to 100%. E) CD317/tetherin cell surface levels of TZM-bl cells expressing patient derived Vpu proteins relative to NL4.3 Vpu. Shown are mean values of triplicate transfections with the indicated standard deviation. The result is representative of three independent experiments. F) Comparison of CD317 cell surface levels in A3.01 cells expressing EC or CP Vpu alleles. Statistical significance was assessed using two-tailed Mann-Whitney U-Test (p = 0.64), bars represent median and interquartile ranges.

