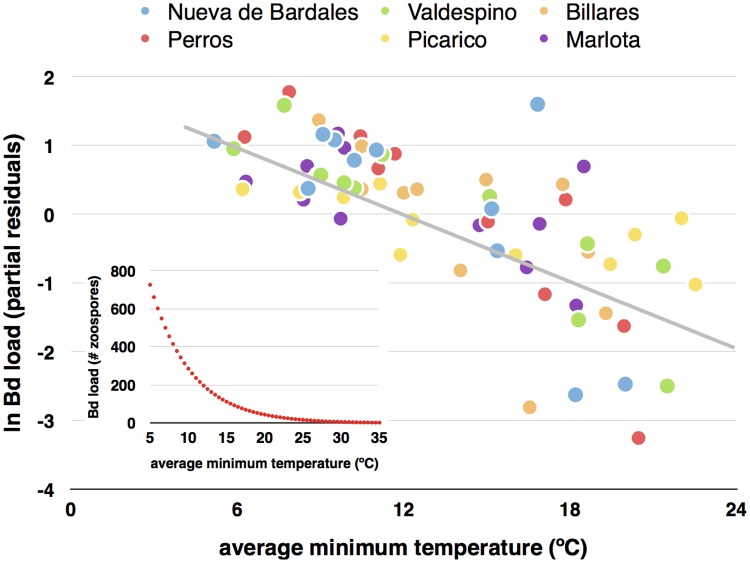
Fig 2. Average minimum water temperature and infection load of Batrachochytrium dendrobatidis.
Partial residual plot illustrating the influence of average minimum water temperature two days before tadpole sampling, on Batrachochytrium dendrobatidis infection load (in logarithm) of Alytes obstetricans tadpoles from six different sites. Sample size is 11 months for each site. The residual plot shows the relationship between minimum temperature and Bd load given that the other two independent variables are also in the model (see with temperature-2 days in Table 1), therefore, partialling out their effects. The inner panel shows the modeled relationship between Bd load (average number of zoospores per tadpole) and average minimum temperature two days before sampling.

