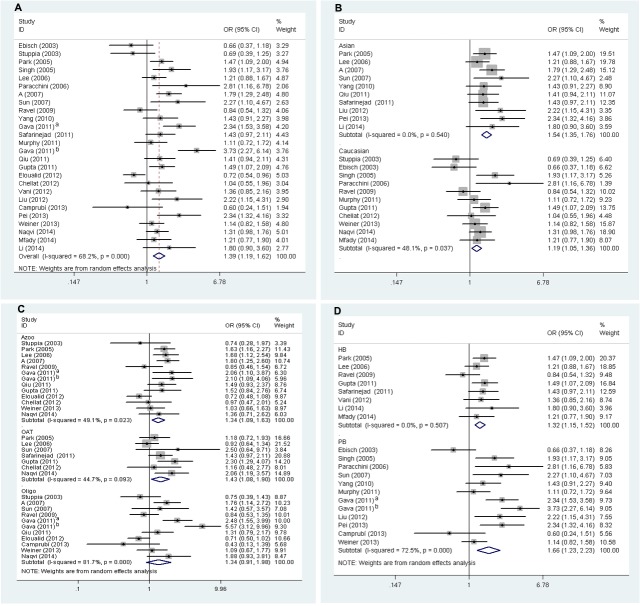
Fig 2. Forest plots of MTHFR 677C>T polymorphism and male infertility risk (CT+TT vs. CC).
[A for overall populations; B for ethnicity subgroup; C for sperm concentration subgroup; D for control sources subgroup]. The squares and horizontal lines correspond to the study-specific OR and 95% CI. The area of the squares reflects the study-specific weight (inverse of the variance). Diamonds represent the pooled OR and 95% CI. athe 37th reference, bthe 49th reference

