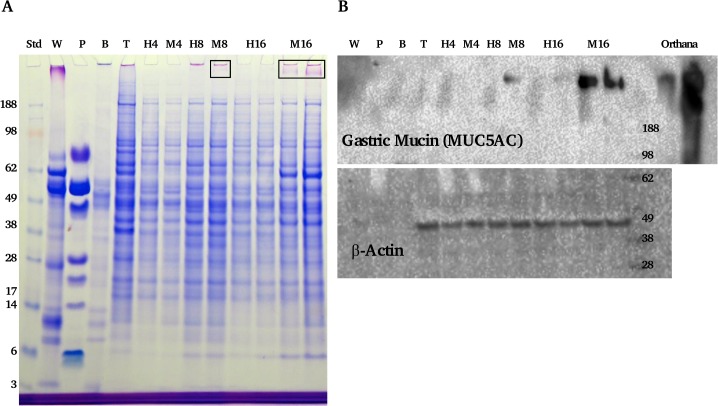
Fig 2. SDS-PAGE gel and wsetern blots of cell homogenates.
Panel A shows a gel stained with CBB and PAS of control cells where no saliva or IgA was bound. H indicates HT29 cells with the number indicating the time point, M indicates the HT29-MTX cells. Other lanes include the molecular weight standard, UWMS (W), PS (P), buccal cell homogenate (B) and TR146 cells (T). Boxes highlight mucus band of the MUC5AC. Panel B shows blots of the same samples, probing for MUC5AC and a cell loading control β-actin.

